Natural Capital and Ecosystem Services Tool Primer
An introduction to tools for ecosystem-service assessment, natural-capital accounting, scenario analysis, and decision support.
Each profile includes a brief description, inputs and outputs, applications, strengths and considerations, and learning resources.
11tool profiles
5consistent sections
1 clickto open any tool
Choose a tool
⌕
Showing all 11 tools
No matching toolsTry a broader term or check the spelling.
Tool 01
Integrated Valuation of Ecosystem Services and Tradeoffs (InVEST)
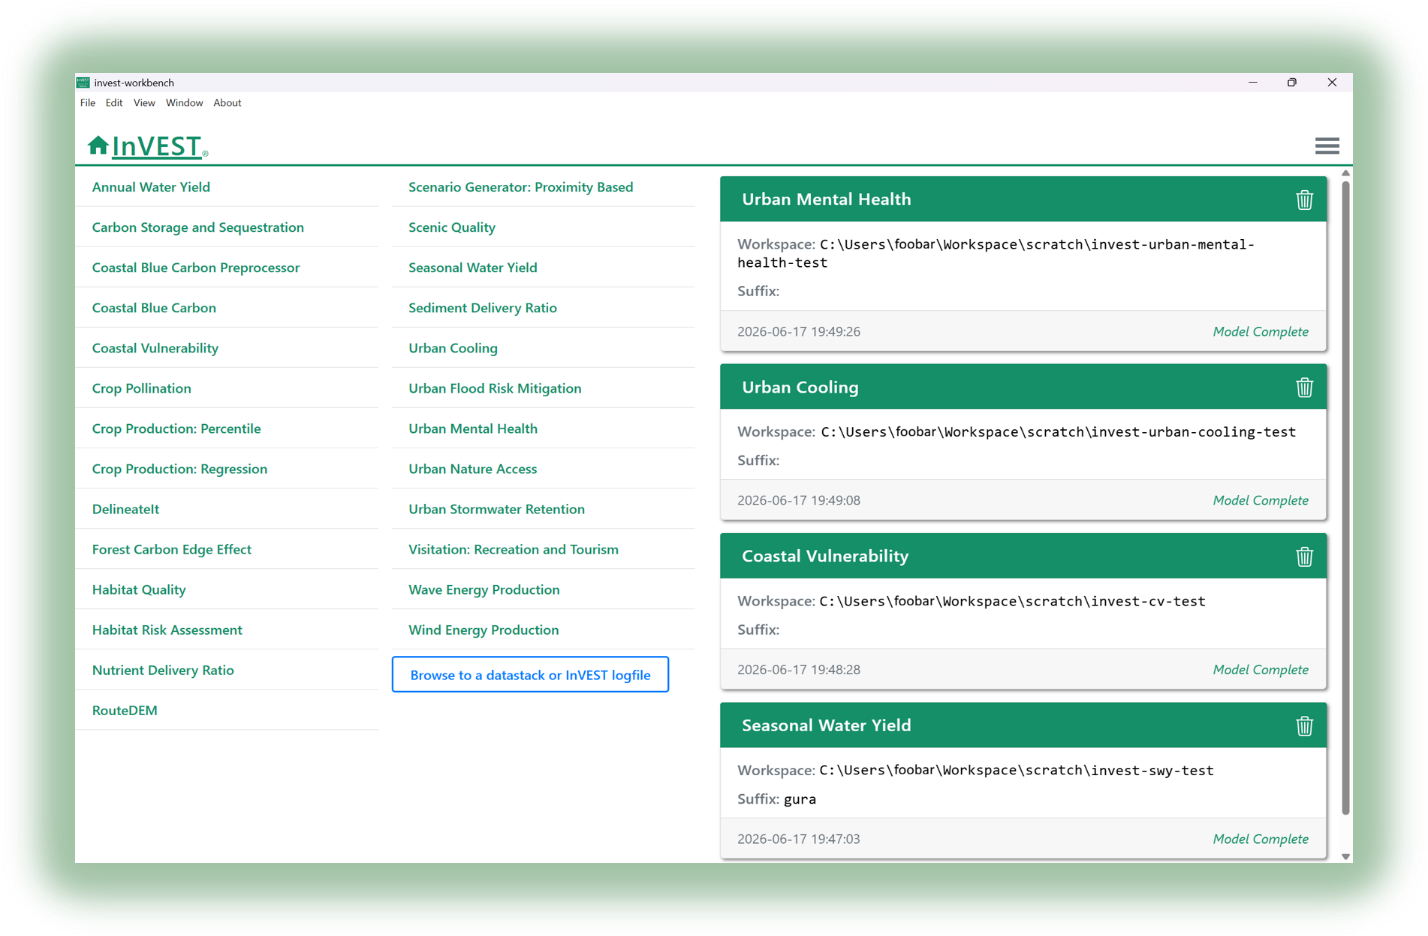
Screenshot of the InVEST software interface and model menu.
1Brief description
InVEST® is a suite of 20+ free, open-source software models and other tools for mapping and valuing the goods and services from nature that sustain and fulfill human life.
2Inputs and outputs
InputsVary by model and may include land cover, climate, soil, elevation, biophysical parameters, and future scenarios.
OutputsMaps and biophysical or economic estimates, such as carbon storage, sediment export, water yield, and habitat quality.
3Applications
See Featured Projects, Research/Publications and BELA Synthesis Report to see examples of how InVEST is used to inform decisions.
+ Good forFree and spatially explicit; covers many ecosystem services and supports scenario comparison.
– Needs technical capacity and validationRequires spatial data and GIS/modeling knowledge, and results depend on data quality and model assumptions.
5Learn
See Learn InVEST for tutorials, training materials, and guidance on using InVEST.
Tool 02
Ecosystem Intelligence (EI)
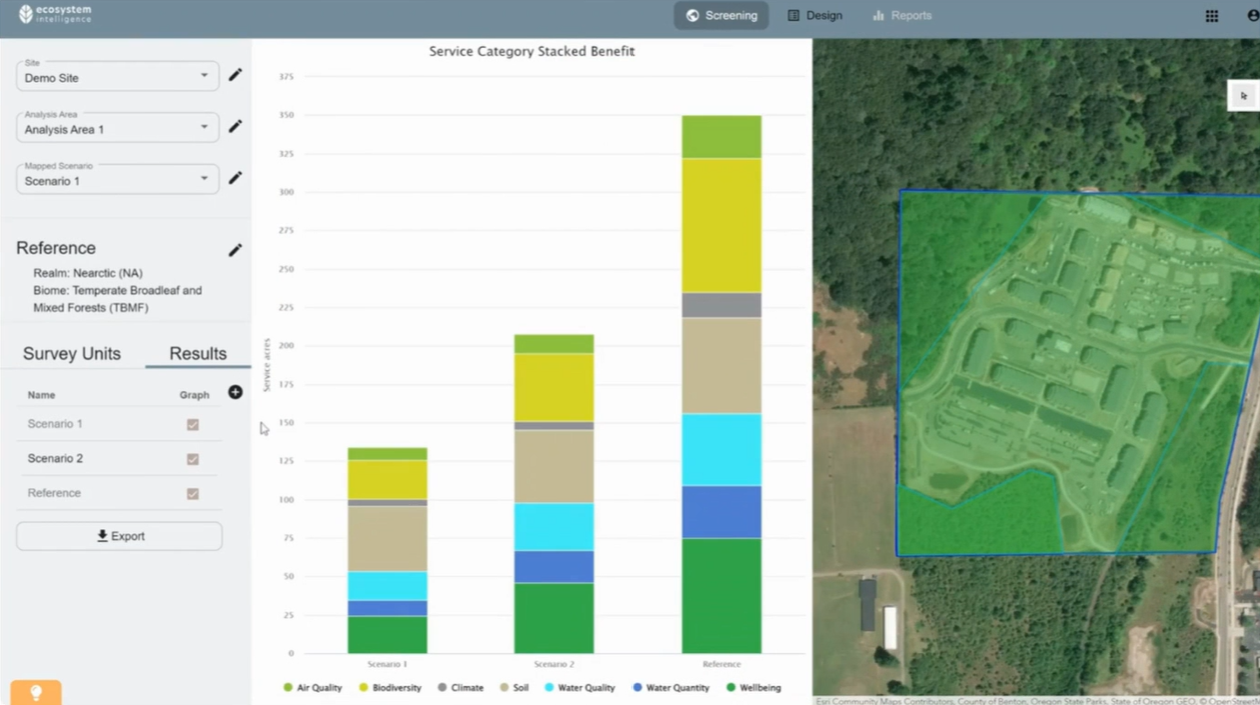
Ecosystem Intelligence platform interface.
1Brief description
Ecosystem Intelligence (EI) is a platform for quantifying ecosystem conditions, functions, and services to support nature-based decision-making. It can assess current site conditions, compare land-use and design scenarios, and monitor ecosystem performance over time and support third-party verification.
2Inputs and outputs
InputsField observations, including vegetation, soil composition, water regime, topography, and other site characteristics; public datasets and satellite imagery.
OutputsEcosystem extent, conditions and services flows, percent performance, function/service acres and spatial performance heat maps.
3Applications
See EI Case Studies and the Microsoft 2025 Environmental Sustainability Report.
+ Good forIntegrates multiple ecosystem services, site-specific data, scenario comparison, and natural capital accounting.
– Data intensiveMay require detailed site-specific data and field observations.
5Learn
See the Ecosystem Intelligence Platform Overview, Training Videos, Webinars, and Ecosystem Services Cascade for information on the platform, methods, and applications.
Artificial Intelligence for Environment & Sustainability (ARIES)
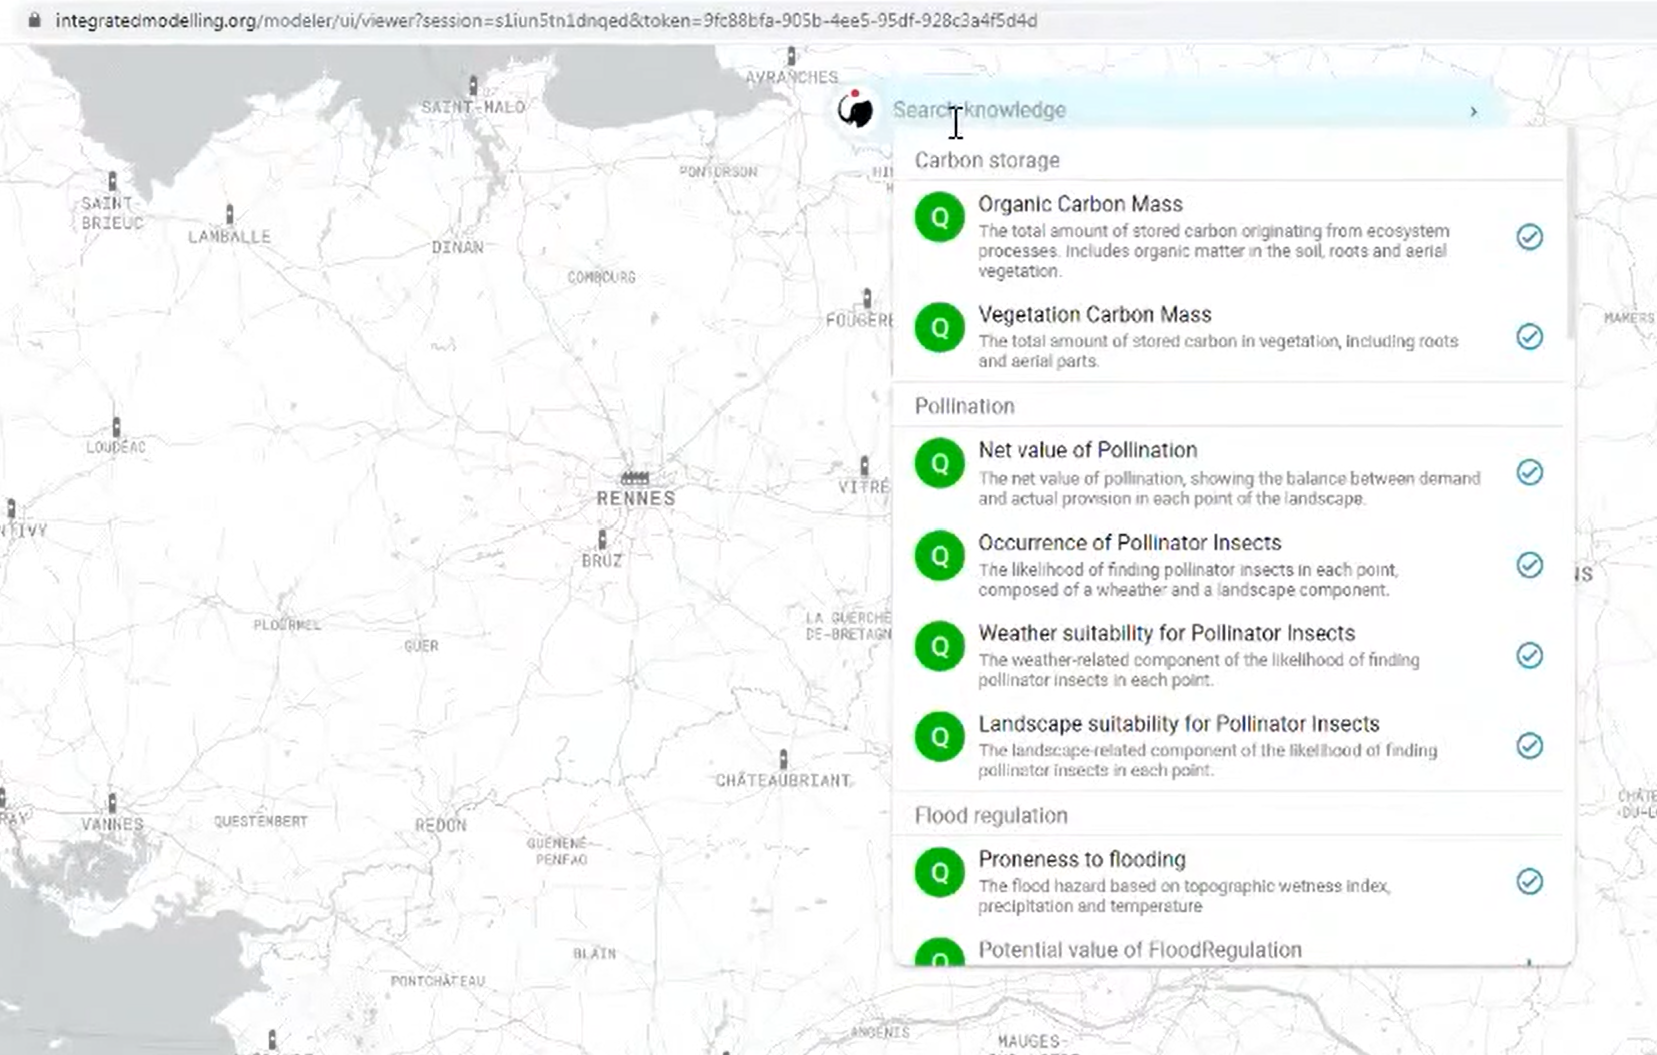
ARIES integrated modelling platform interface.
1Brief description
ARIES is an integrated modelling platform that uses artificial intelligence, semantics, and machine reasoning to connect data and models for environmental assessment and decision-making. It can assess ecosystem services, including where services are generated, how they flow through landscapes, and who benefits from them.
2Inputs and outputs
InputsData and model components describing ecosystems, landscapes, and human activities. ARIES uses k.LAB to automatically select and connect relevant data and models based on the assessment context.
OutputsMaps, tables, graphs, and reports, with dataflow and provenance information documenting how results were generated.
3Applications
See ARIES Ecosystem Services, ARIES Worldwide Projects, and an ARIES application quantifying and valuing ecosystem services in the San Pedro River Basin
+ Good forIntegrates diverse data and models, represents spatial ecosystem-service flows and beneficiaries, and provides reusable modelling components.
– Technically complexIts semantic modelling approach can be complex, and results depend on the availability and suitability of underlying data and models.
5Learn
See ARIES Get Started, ARIES Publications, and Assessing ecosystem services with k.LAB – the technology powering ARIES.
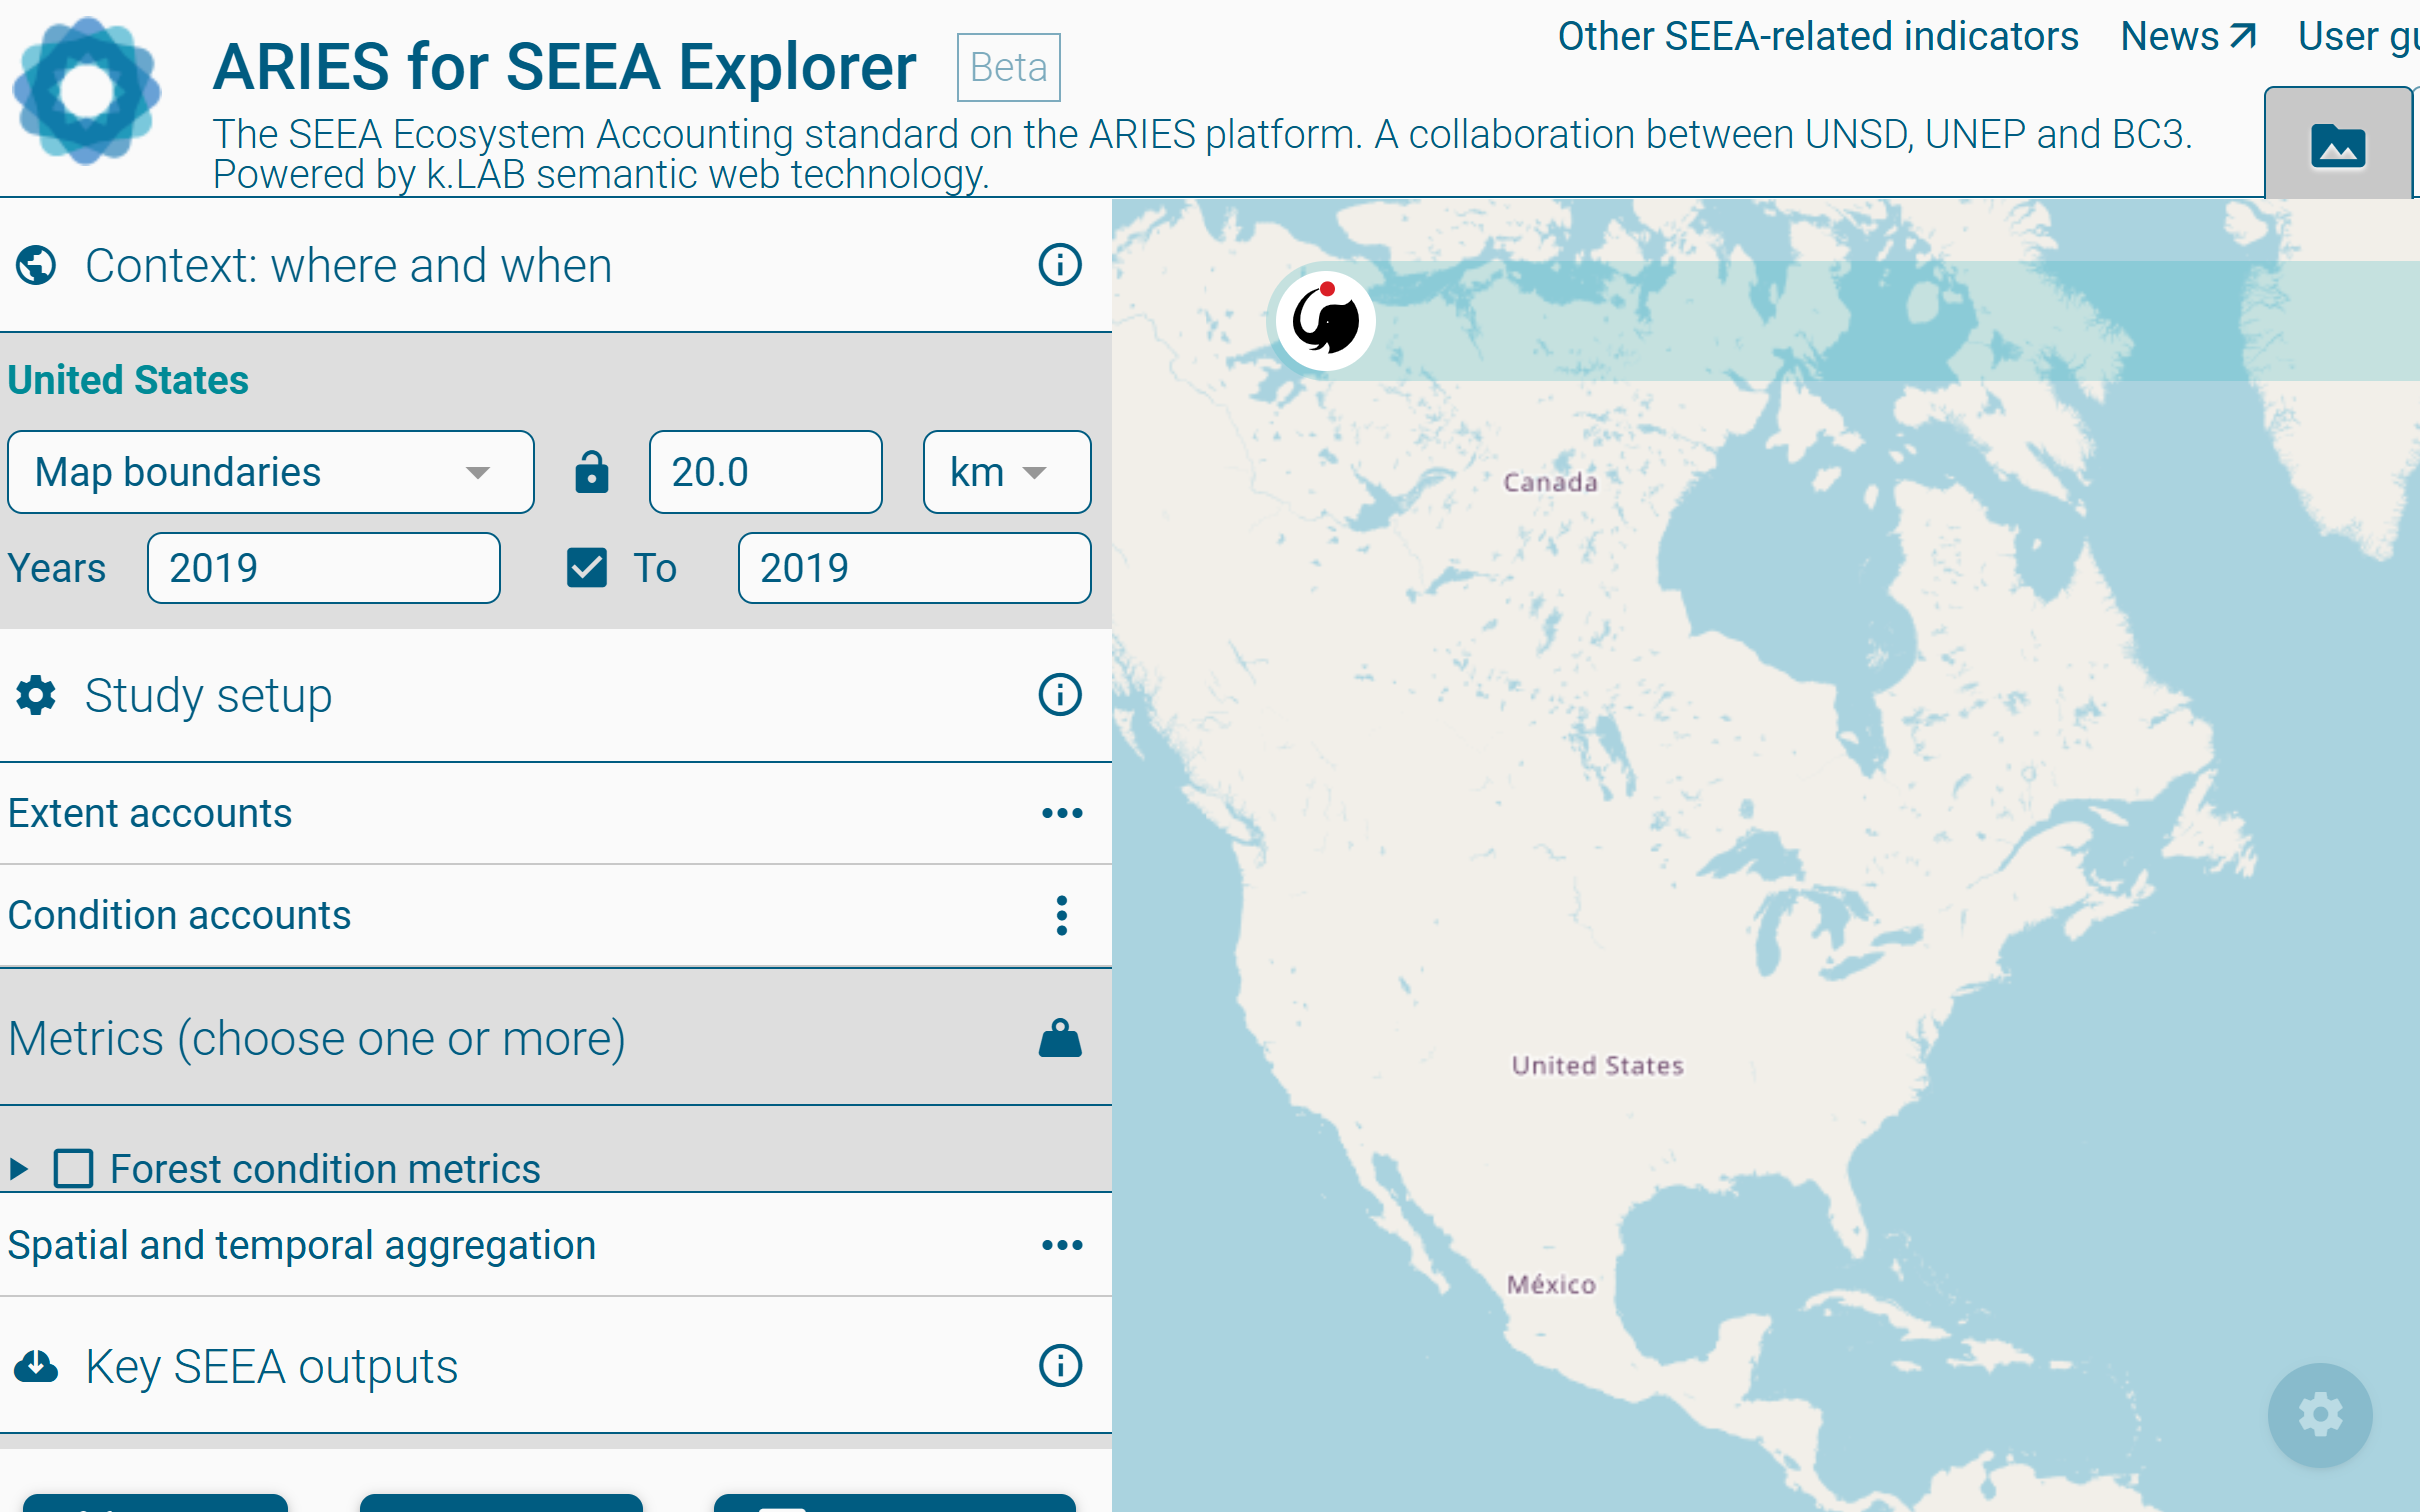
ARIES for SEEA Explorer is a web-based application built on the open-source ARIES modelling platform that enables users to rapidly produce standardized, scalable, and customizable ecosystem accounts consistent with the SEEA Ecosystem Accounting framework.
2Inputs and outputs
InputsUsers specify the geographic area, spatial resolution, year(s), and ecosystem account(s) to compile.
OutputsEcosystem extent, condition, and service accounts in physical and/or monetary units, with a report documenting the data, models, coefficients, and methods used.
+ Good forOpen source, web-based, globally applicable, and automates data and model integration.
– Limited coverage and validationCurrently supports a limited set of ecosystem accounts and services, and results may require validation with local data.
5Learn
See the ARIES for SEEA User Guide, the ARIES for SEEA Workshop for training materials and demonstrations.
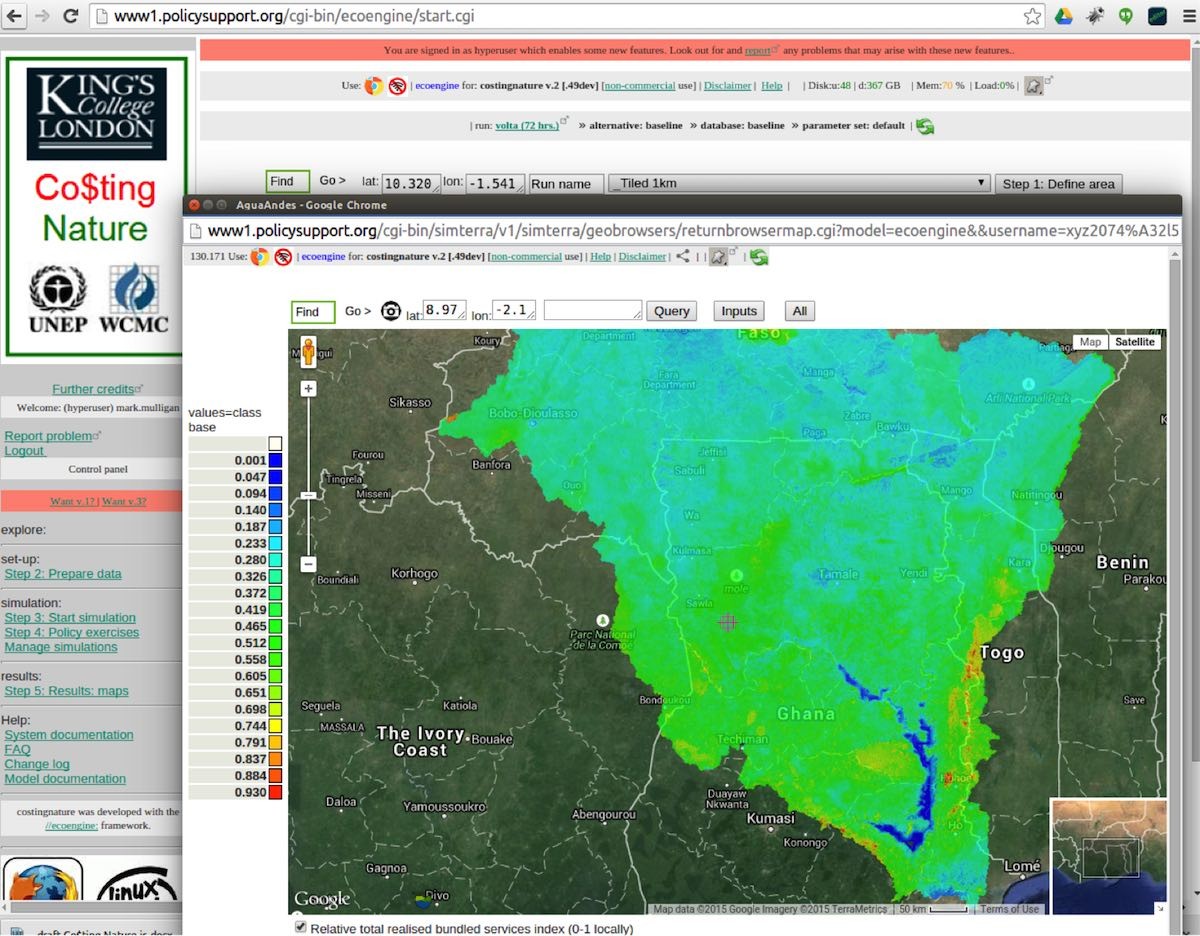
Co$tingNature spatial policy support system interface.
1Brief description
Co$tingNature is a web-based spatial policy support system for mapping natural capital and the supply and demand of ecosystem services, identifying beneficiaries, and assessing the impacts of land-use change, climate change, and human interventions. It is globally applicable from local to national scales. (Sources)
2Inputs and outputs
InputsBuilt-in global spatial datasets and models; users can also provide their own spatial data.
OutputsMaps of global and regional relative conservation priority based on 18 ecosystem services, biodiversity, current human pressure and future threat, nature's contribution to SDGs, individually and collectively.
3Applications
See Example Applications for applications in ecosystem-service assessment, conservation prioritization, land-use change, REDD+, agriculture and mining.
4Pros and cons
+Good forGlobal, web-based analysis of 18 ecosystem services, conservation priorities, and scenarios using built-in data.
−ConsiderationsCustom data require GIS capacity, and results may need local validation.
5Learn
See Training for training videos, practical exercises, and documentation on using Co$ting Nature.
Tool 06
Data4Nature (D4N)
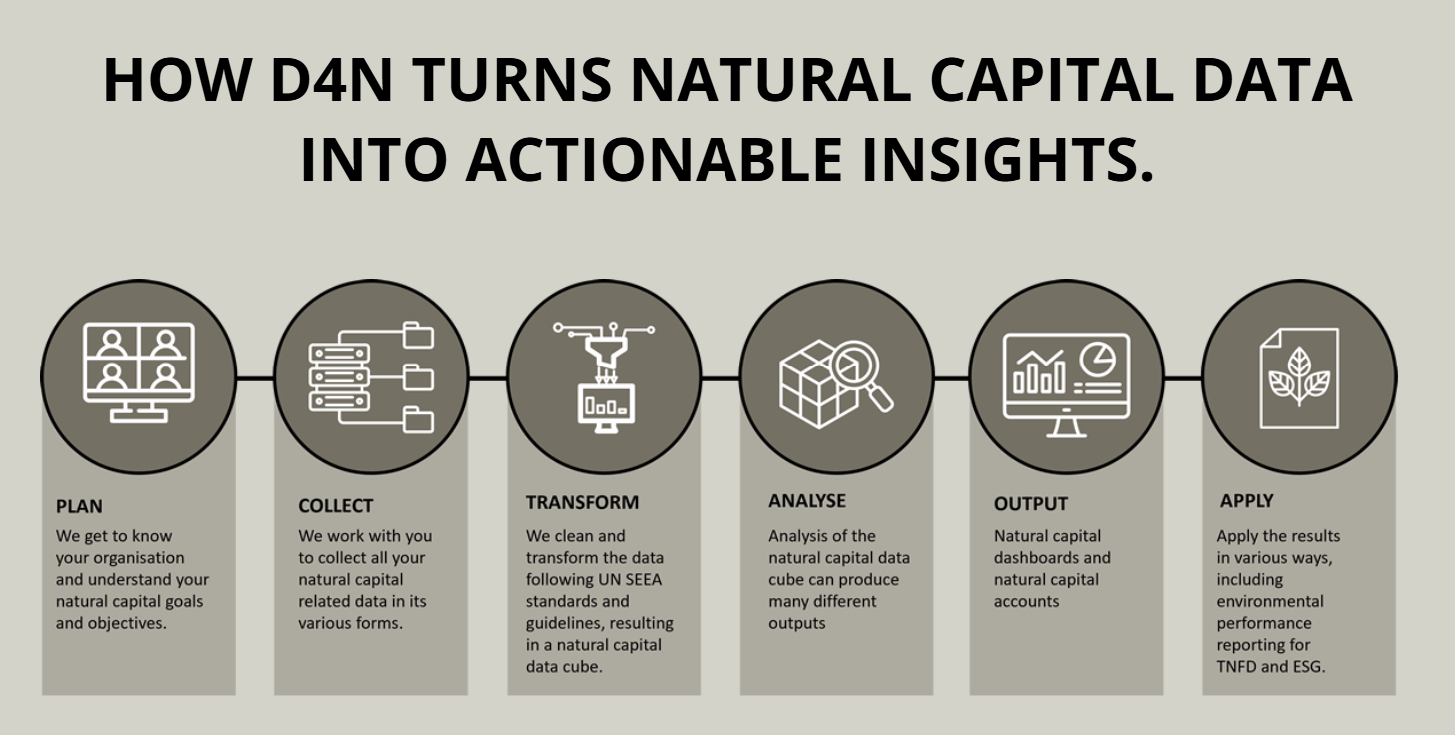
How Data4Nature turns natural-capital data into actionable insights.
1Brief description
Data4Nature (D4N), a natural-capital data management platform that integrates environmental and spatial data to support SEEA-aligned natural-capital accounting, spatial mapping, scenario modelling, and environmental reporting.
2Inputs and outputs
Inputs. Environmental and spatial data such as soil, water, biodiversity, land use, climate, and other technical, financial, or economic data, depending on the analysis.
OutputsNatural-capital accounts and decision-support products, including extent and condition accounts, ecosystem-service valuations, risk registers, balance sheets, maps, graphs, tables, dashboards, and reports.
3Applications
See Customers for applications in in natural-capital accounting, nature-related reporting, ecosystem assessment, scenario analysis, and restoration planning.
4Pros and cons
+ Good forCombines spatial ecology and economics, supports SEEA-aligned natural-capital accounting, and provides integrated analysis and reporting from farm to global scales.
− ConsiderationsAccess is service/subscription based, and analyses depend on the availability and quality of appropriate environmental and spatial data.
5Learn
See the Features page and News for information on platform capabilities, updates, and access options.
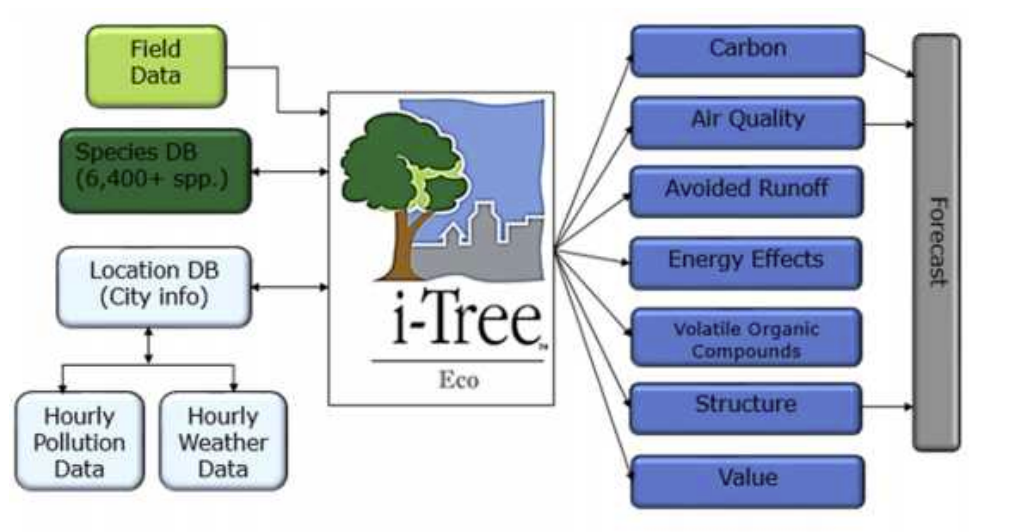
Inputs and ecosystem-service outputs from i-Tree Eco.
1Brief description
i-Tree is a tool developed by the USDA Forest Service with capabilities of modelling ecosystem services related to trees, particularly in urban settings (i.e. air filtration, carbon storage, urban heat island mitigation, and rainfall interception and infiltration). (Resources)
2Inputs and outputs
InputsVary by i-Tree tool and may include tree and land-cover data (e.g., species, size, canopy, condition and tree cover) and local environmental data such as weather and air pollution.
OutputsPhysical and monetary estimates of tree-related ecosystem services, including carbon storage and sequestration, air-pollution removal, storm water runoff reduction and building energy effects.
3Applications
See Project Profiles for examples of how i-Tree tools have been applied to inform management strategies and community decisions.
4Pros and cons
+ Good forfree and widely used for quantifying and communicating tree and forest ecosystem services, particularly in urban settings.
– ConsiderationsPrimarily focused on tree- and forest-related ecosystem services. In some cases, the output is not spatially explicit, which may limit its adoption for the SEEA EA.
5Learn
See Video Learning and Manuals, Guides & Workbooks for guidance on using i-Tree tools.
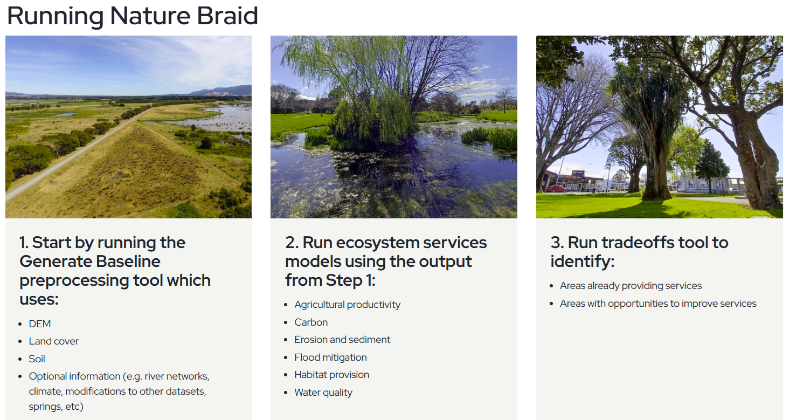
Nature Braid is a high-resolution environmental and ecosystem-services modelling framework and the next-generation implementation of LUCI (Land Utilisation and Capability Indicator). It assesses how land use, land management, and climate affect environmental processes and ecosystem services and supports restoration and land-management decisions.
2Inputs and outputs
InputsAt minimum, a digital elevation model (DEM), land-cover information, and soil information; optional inputs include stream networks, precipitation, evapotranspiration, climate, and other local data.
OutputsFine-scale spatial maps, statistics, tables, and reports for ecosystem services, including opportunities for intervention and trade-offs or synergies among services.
+ Good forHigh-resolution analysis of land-management scenarios and spatial trade-offs, particularly for hydrology, soils, water quality, habitat, and restoration.
– ConsiderationsThe current main toolbox requires ArcMap or ArcGIS Pro, and applications in unsupported regions may require additional parameterization.
5Learn
See the Nature Braid website, Using Nature Braid, and Documentation for installation, data requirements, models, and guidance.
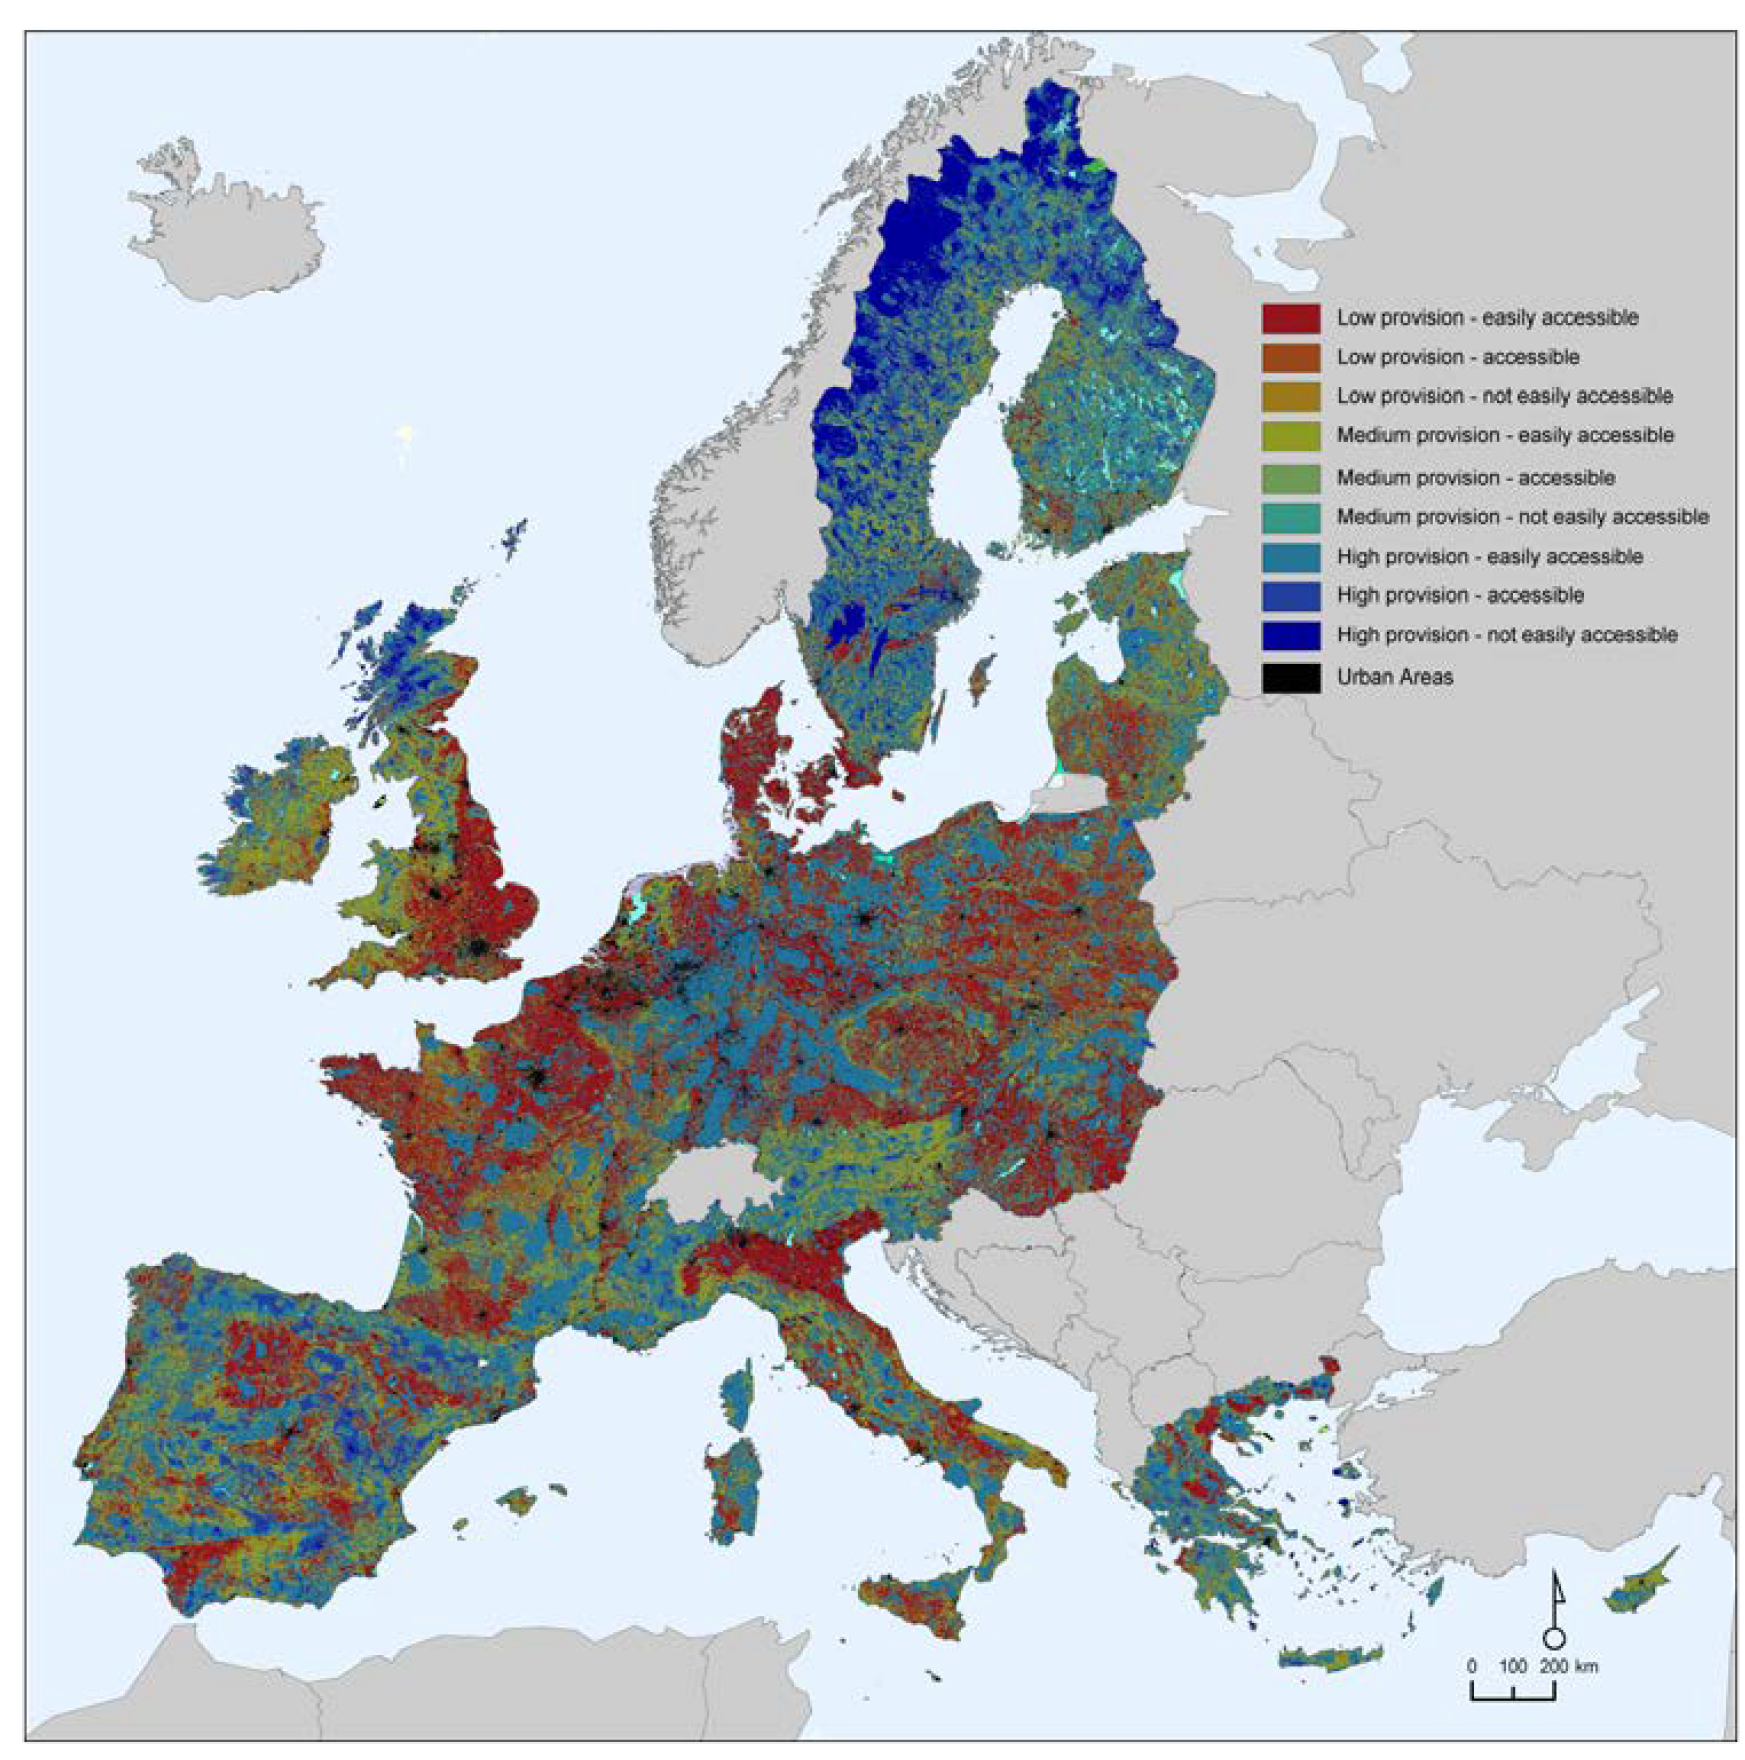
ESTIMAP map of ecosystem-service provision and accessibility across Europe.
1Brief description
ESTIMAP is a collection of spatially explicit models and methods developed by the European Commission Joint Research Centre (JRC) to map and assess ecosystem services in a multiscale perspective. It currently includes 12 models for ecosystem services (pollination, nature-based recreation, air quality regulation, microclimate regulation, coastal protection, flood control, carbon sequestration, erosion control, habitat maintenance, habitat quality and pest control).
2Inputs and outputs
InputsVary by ecosystem service and may include land cover/land use, environmental and biophysical data, protected areas, roads and accessibility, and population data.
OutputsSpatial maps and indicators of ecosystem-service potential/capacity, supply, demand, flow, and benefits, depending on the ecosystem-service model.
3Applications
See ESTIMAP: Ecosystem services mapping at European scale, Practical application of spatial ecosystem service models, and Ecosystem services accounting: outdoor recreation and crop pollination for applications in ecosystem-service mapping, planning, and accounting.
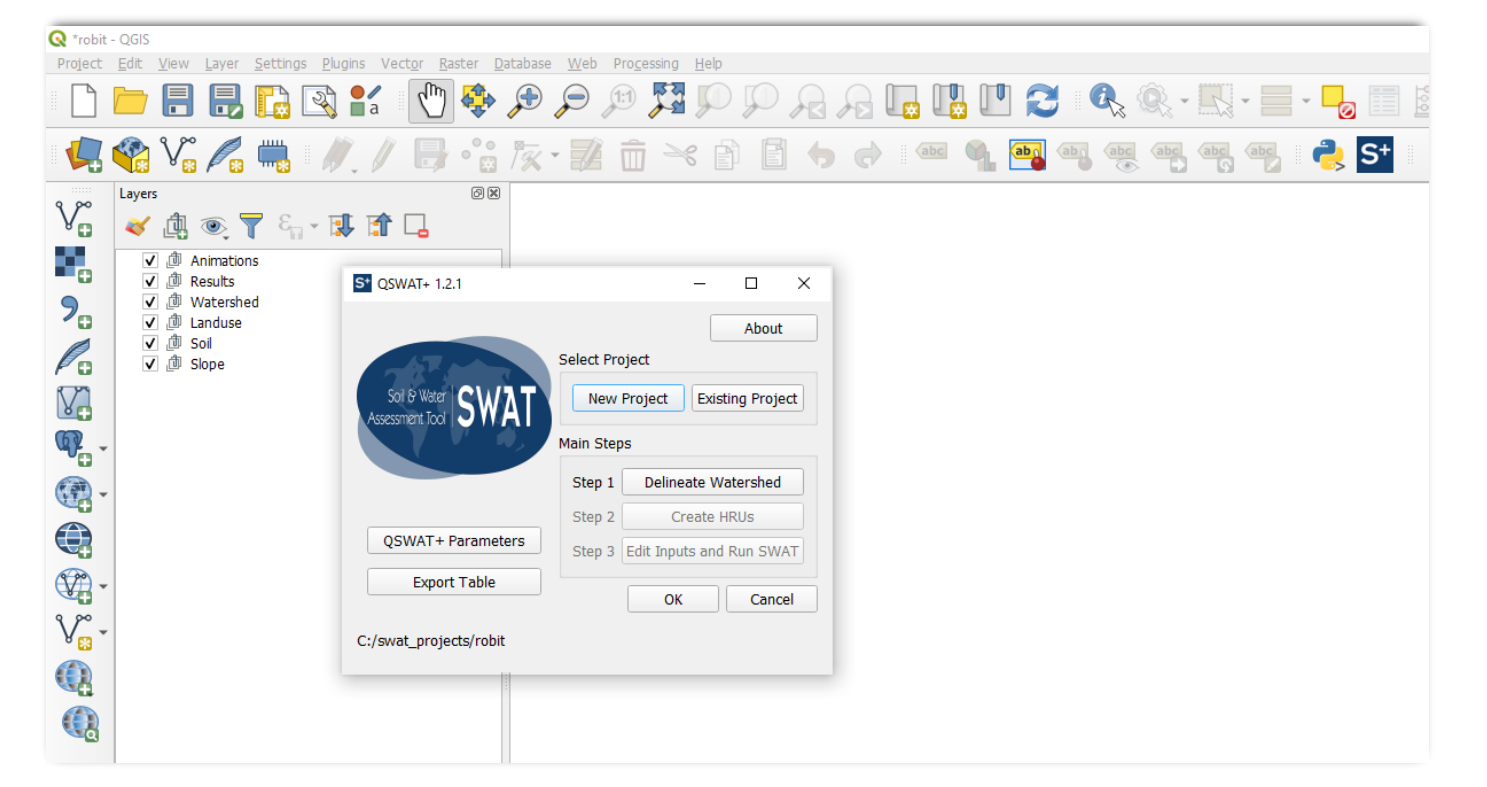
The Soil & Water Assessment Tool (SWAT) is a small watershed- to river basin-scale model used to simulate the quality and quantity of surface and groundwater and predict the environmental impacts of land use, land management practices, and climate change. SWAT is widely used in assessing soil erosion prevention and control, non-point source pollution control, and regional management in watersheds. SWAT+ is the modernized successor to SWAT.
2Inputs and outputs
InputsDEM, land use, soils, climate, management practices, and model parameters.
OutputsDaily, monthly, or annual estimates of water balance and flow, sediment, nutrients, carbon, pesticides and other constituents, and plant growth/crop yield.
+ Good forAssessing water quantity and quality, soil erosion and non-point-source pollution, management practices, and climate-change impacts from small watersheds to large river basins.
– ConsiderationsRequires multiple spatial, climate, soil, land-use, and management inputs. Model setup, parameterization, calibration, and validation can require substantial technical expertise and data.
5Learn
See the SWAT/SWAT+ documentation for software, tutorials, training, workshops, model documentation, and support resources.
Tool 11
Hydrologic and Water Quality System (HAWQS)
1Brief description
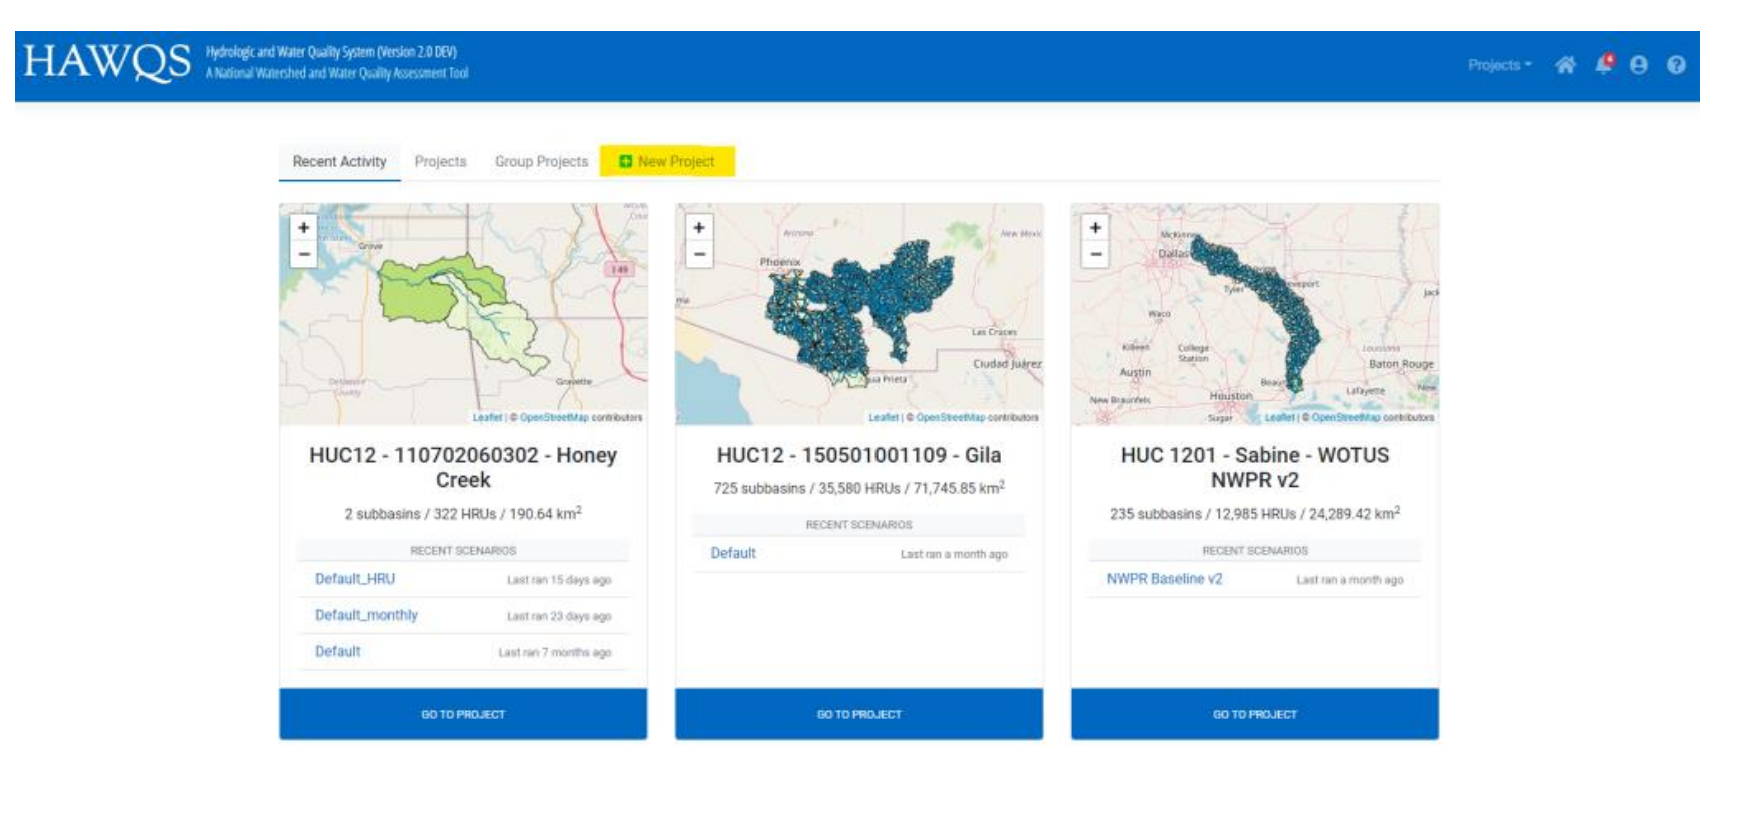
The Hydrologic and Water Quality System (HAWQS) is a web-based interactive water quantity and quality modeling system that uses the Soil and Water Assessment Tool (SWAT) as its core modeling engine. HAWQS provides interactive web interfaces and maps, pre-loaded input data, and online development and execution of modeling projects.
2Inputs and outputs
InputsPre-loaded spatial and environmental datasets that users can customize, together with scenario inputs such as agricultural management and conservation practices, fertilizer and urban inputs, curve numbers, climate-change/sensitivity settings, and point sources.
OutputsMaps, charts, tables, and raw output data for water quantity and water-quality variables, including sediment, nutrients, pathogens, biological oxygen demand, dissolved oxygen, pesticides, and water temperature. .
3Applications
See the HAWQS 2.0 Use Cases for examples assessing baseline conditions and changes in land use, point sources, and agricultural management practices.
4Pros and cons
+ Good forThe online, pre-loaded data approach makes initial applications easier. HAWQS runs on a server, so personal computing requirements are minimal.
– ConsiderationsThe modeling system does not provide direct access to the full set of SWAT model functions, which can limit users' ability to tailor the model to site-specific conditions.
5Learn
See the HAWQS Help and Documentation for the user guide, introductory materials, information on HAWQS, and instructions for creating and running projects.