Air Pollution
Global Context
Air Pollution – At a Glance
-
Over 90% of the global population breathes unsafe air.
-
About 7 million people die of air pollution globally every year.
-
Indoor air pollution causes ~3.8 million premature deaths each year, with about 60% among them are women and children.
-
Air pollution causes over USD 5 trillion in welfare losses globally every year.
Air pollution has become a major issue in many countries. It is responsible for about 7 million premature deaths due to outdoor and indoor air pollution, with 91% of deaths occurring in low and middle-income countries along with associated health issues and disrupting normal lives for millions of people. Air quality is estimated to cost US $5.7 trillion globally every year in health damages equivalent to 4.8% of global GDP.
The interactive graphic below (may load slowly) is a useful way to visualize the Global Burden of Disease due to air pollution from the Institute for Health Metrics and Evaluation (IHME) – select your location, types of air pollution and other parameters to explore mortality and morbidity implications.
Technology could play a role in helping all aspects of air quality management – from better monitoring, analyzing and understanding these systems to promote innovations in reducing emissions and risk.
Monitoring
Lima Peru has a population of 8.6 million people. It suffers from one of the worst air pollution in Latin America that causes 1,600 premature deaths a year, along with countless illnesses and time off from work. The city signed the C40 clean air declaration to meet WHO air quality guidelines by 2030. As part of their commitment to improving air quality, the local government unveiled its publicly available air quality monitoring system to increase transparency and enhance civil society engagement. Ultimately, this will allow for improved decision making, better public policy, and reduce mobility and mortality. The air monitoring system incorporates low-cost sensors that are highly effective in obtaining ground-level noise exposure and air quality pollutants at a micro-level. Data is displayed on a publicly available web-based platform using color coding to display real-time information. In the future, it is expected to have up to 30 air quality stations and use dynamic displays at football stadiums to display weather and air quality data.
Air pollution in London costs £3.7 billion every year, and pollution ranges significantly where citizens can breathe up to 25 percent more nitrogen dioxide pollution than the best-case area. As part of the city’s involvement in the C40 initiative to improve air quality, called “Breath London,” they partnered with NGOs, academia, and private partners. Air quality monitoring was performed using sensor pods, sensors mounted on vehicles, and student engagement. Breath London installed 100 state of the art sensor pods on lamppost and building in the worst affected areas with continuous reading. Google Street View cars were fitted with mobile sensors and drove 1000 miles of roadway, obtaining measurements every 30 meters. Students wore backpacks with sensors to measure pollutants on their way to and from school. The evidence can be used by government officials to develop better policy, allowing for more robust intervention methods with support from the local community.
Breathe London (click to access Portal)
Air quality is a health risk, and publicly available air quality information does not provide data sub-hourly to account for changing traffic, street level or forecast future conditions in air pollution. Climacell provides microclimate data by incorporating their micro-weather forecasting with air pollution data. The micro weather climate data uses publicly available weather data along with signal information from connected cars, airplane data on wind, temperature and humidity, information on cell tower signals and precipitation and visibility from street cameras. Air quality data comes from satellite observations, ground based measurements, and current traffic patterns. Using this information with weather models that is coupled with chemistry and applying machine learning they can produce predictions of historical, near real time, and forecast air pollution anywhere in the world.
In-Situ Monitoring
The GSMA , acting in the role of an operator and systems integrator, is deploying a range of low-cost static and mobile IoT sensors in diverse ways (e.g., carried by people, on bikes, on vehicles, on buildings) with analytics and machine learning to measure local air quality. All the IoT sensors include mobile communications capabilities and report data throughout the day. ( GSMA ). The sensors, cameras and an online Air Pollution Monitoring in China on construction sites, to measure pollution and weather conditions on sites, the data is processed to the specification of the Ministry of Environment Protection, alarms are triggered when sites do not meet emissions standards.
Deutsche Telekom working with the sensor provider Smart Sense40 have developed and deployed Smart AirQ monitoring system, a smart sensor platform for monitoring air quality. The solution, which was initially deployed within city of Dubrovnik, Croatia and has now been deployed in four different countries on two different continents: in Croatia, Germany, Greece and Saudi Arabia ( GSMA )
In Sao Paolo Brazil, Telefonica trialed in using open data from existing air quality sensors and mobility data to estimate the number of vehicles and their locations.
Isotope and Radionuclide Monitoring
Institutions like the International Atomic Energy Agency (IAEA) are using isotopic and nuclear tools to monitor the pathways of pollutants through the atmosphere and estimate their distribution and ecosystem impact. Radionuclides (such as beryllium-7m, caesium-137 and lead-210) in the atmosphere attach to aerosol particles and are monitored to understand their transport and fate.
Crowdsourcing Air Pollution Monitoring
Bogota, Columbia, like many other developing cities in the world, faces air pollution challenges with a limited number of hourly monitoring stations. Citizens developed a community-based crowdsourcing sensor called CanairIO , Spanish for canary, an idiom for the canary in the coal mine. CanairIO is a low-cost sensor (under 100 USD) using off-the-shelf hardware including GPS, open-source software, and connected to the internet via WIFI or cellular Bluetooth monitors pollution at a micro-level. Using more than 30 sensors by tracking and monitoring pollution on roads via bikes, walking around bus stations, and bus ride, they were able to convince city officials to replace old diesel busses with new buses powered by natural gas.
Another great example of a crowdsourcing solution to monitor Air quality is the open-source environmental data visualization platform called Air Casting developed by a group of US activists responding to the needs of their community to map contaminated properties and hazardous facilities.
Their solution includes a palm sized air quality instrument called the Air Beam, a low-cost tool that measures local concentrations of PM. This small portable sensor connects with the free to use Air Casting platform that helps the users map air pollution. The application collects also data form other environmental monitoring devices to create one of the largest open-source databases of community-collected air quality measurements. The small sensor can be installed indoors or outdoors when used in fixed mode. It can be also carried by the user to collect data on the go. It relies on a Bluetooth connection when used in mobile mode and it will communicate with the website via either the WiFi or cellular network when used as a fixed instrument.
Air Casting (click to access Portal)
New mechanisms have been developed to create friendly user sensors to collect local pollution data. An example of this are Pollution Badges that can be carried by anyone or attached to walls or critical locations to monitor local environmental conditions and check whether pollution levels are getting too high. The information can be also used to contribute to community generated pollution maps.
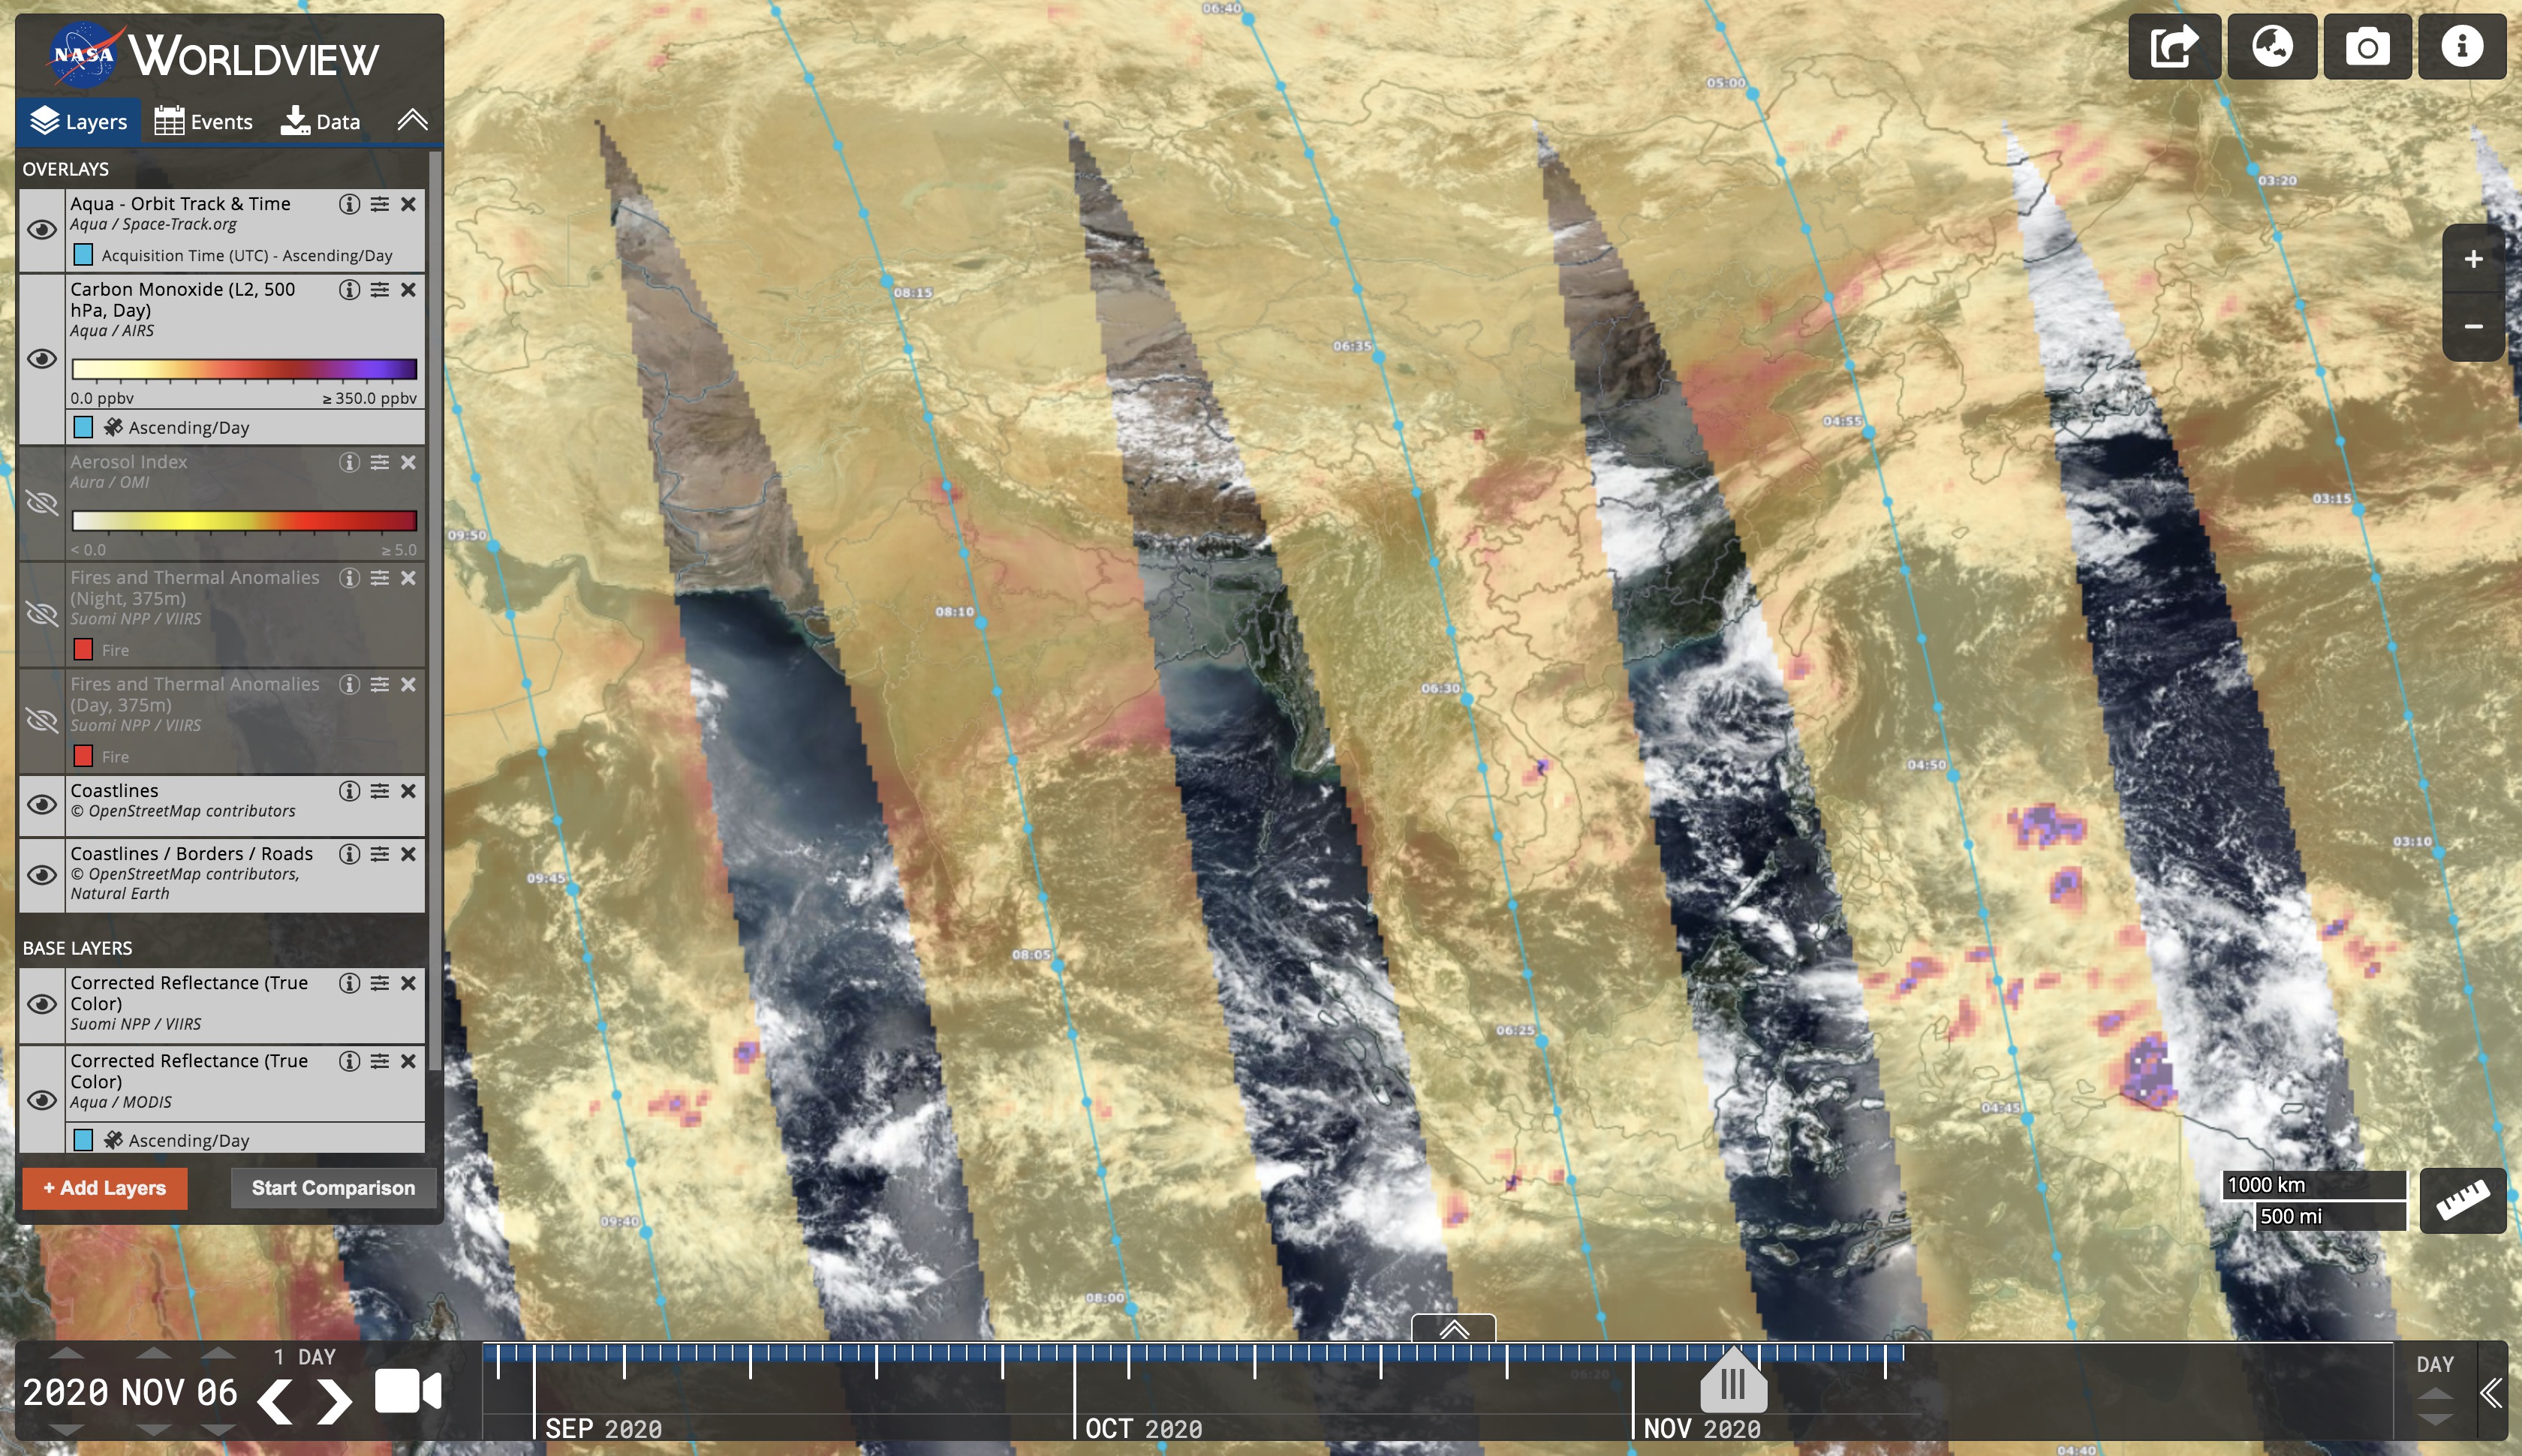
Earth Observation: Satellite Remote Sensing of Air Pollution
Satellites provide data on air pollution when there are spatial gaps, and monitoring data is not available. Understanding the source and quantity of pollution allows for the appropriate mitigation measures to protect human health and the environment. Pollutant measurements are not direct measurements per se but are computed geophysical parameters using the radiative transfer theory of measured radiation. A few of the pollutants that can be monitored are Carbon Monoxide, Nitrogen Dioxide, Sulfur Dioxide, Green House Gases (Methane and Carbon Monoxide), and PM2.5. Sentinel 5P has been used to monitor methane emission worldwide, especially in the oil and gas industry, a major polluter, a major polluter. Nitrogen dioxide emission caused by the combustion of industrial and car emissions has been reduced in Italy due to the Coronavirus.
This app from NASA's Earth Observing System Data and Information System (EOSDIS) provides the capability to interactively browse full-resolution satellite imagery layers, that among other applications, supports air quality measurements at almost real time.
Click to Access NASA Worldview Portal:
Drones equipped with compact sensors can provide data at nearly any point in a three-dimensional axis, this interesting characteristic favors the reduction of sensor nodes used in every project, diminishing the total cost of the solution. Additionally, it permits the user to obtain local data for production monitoring, problem detection and local climate control. This uses a wireless sensor network that is low cost, portable, capable of data storage and wireless transmission of data. Another additional requirement was time and location stamping of gas measurements, which was accomplished with an integrated GPS module. While the drone flies, the sensors take measurements and send, via GPRS, the information directly to the database, where it is processed. It can be used in areas where high concentration of air pollutants is a concern, such as industrial areas, harbors, or airports. The use of more than one drone could offer simultaneous data at different locations and heights, giving the opportunity to investigate air quality at a bigger scale.
These approaches are critical in areas that are difficult to access or are spread out. For example, air pollution in Greece has been a serious environmental problem in the last decades. Rapid and disorganized urbanization, lack of infrastructure and an increasing motor vehicle fleet in urban regions were the main causes of air quality deterioration in the country. With more than 1,400 islands, maritime and air transport are common in Greece exacerbating air pollution. The evaluation of air quality and pollution has been traditionally conducted by ground-based monitoring. The complexity of the terrain and physical barriers usually complicate data collection, augmenting costs and decreasing efficiency and performance.
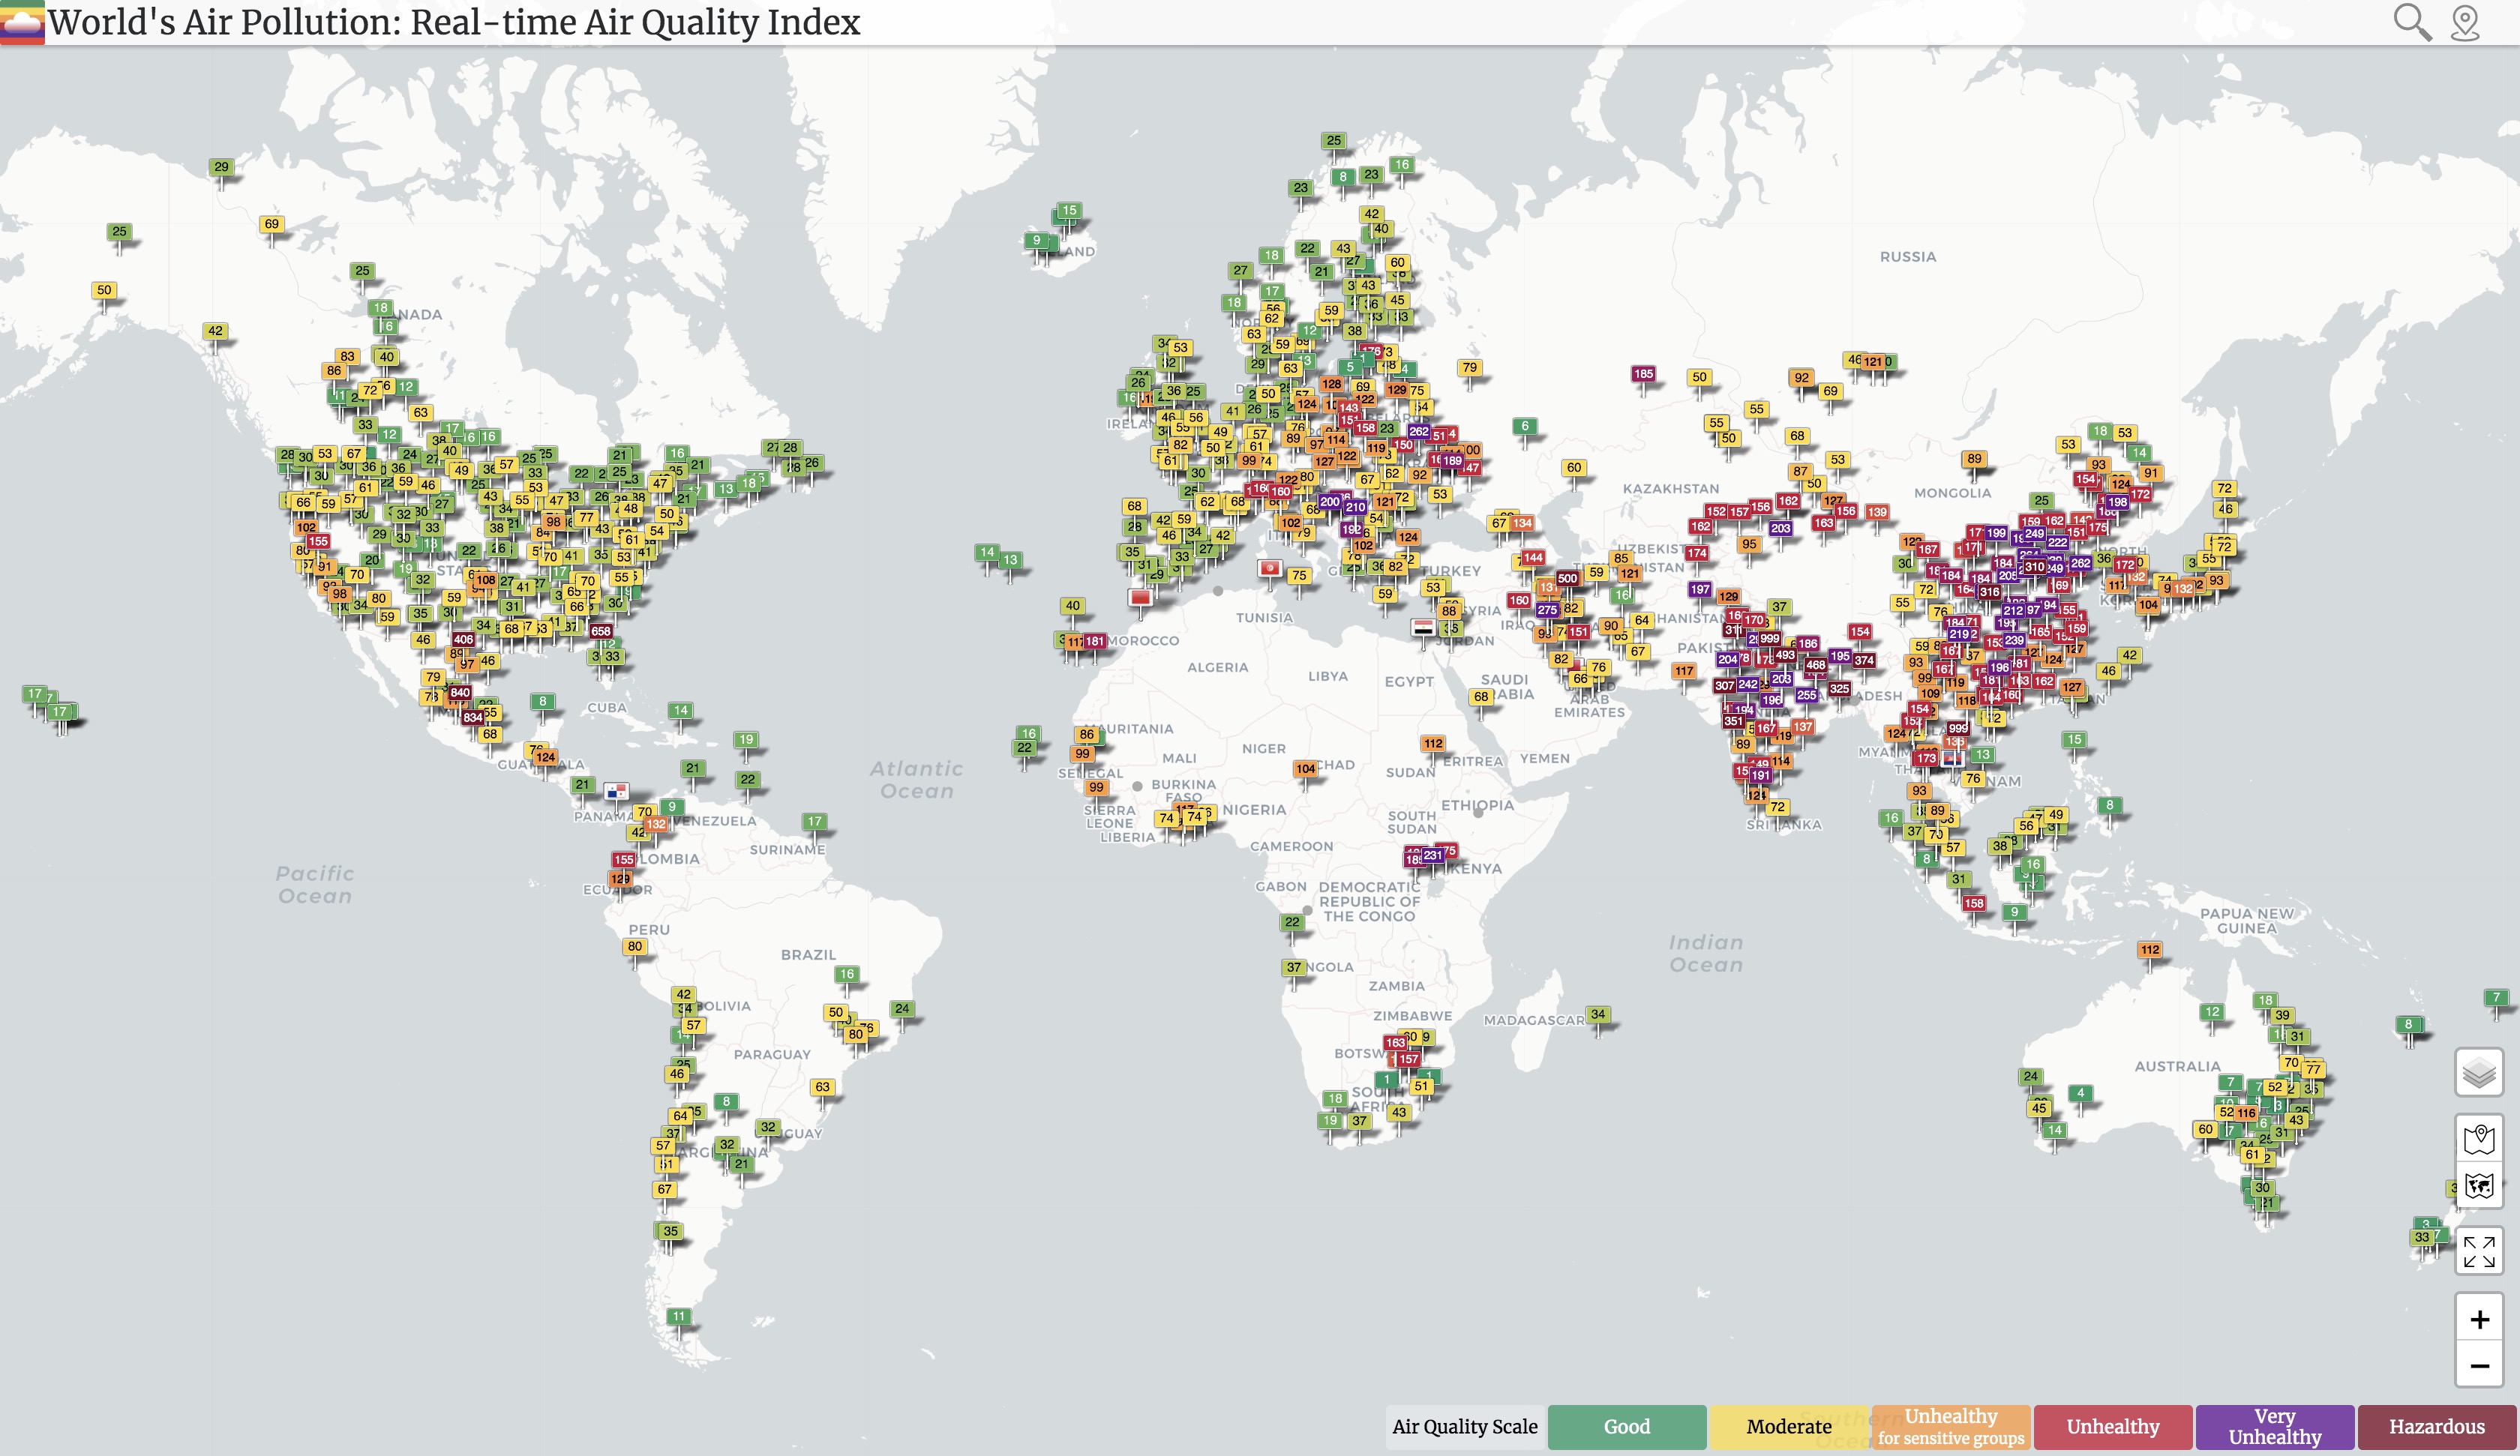
Data Repositories
Data on air quality is increasingly being made accessible in global data repositories. Two common ones are WAQI and OPENAQ that make available a range of government and other in-situ monitoring data from countries around the world. However, as can be seen at these sites, there are many countries that do not report their data in the public domain – a pre-requisite to improve awareness and meaningful action on outdoor air quality.
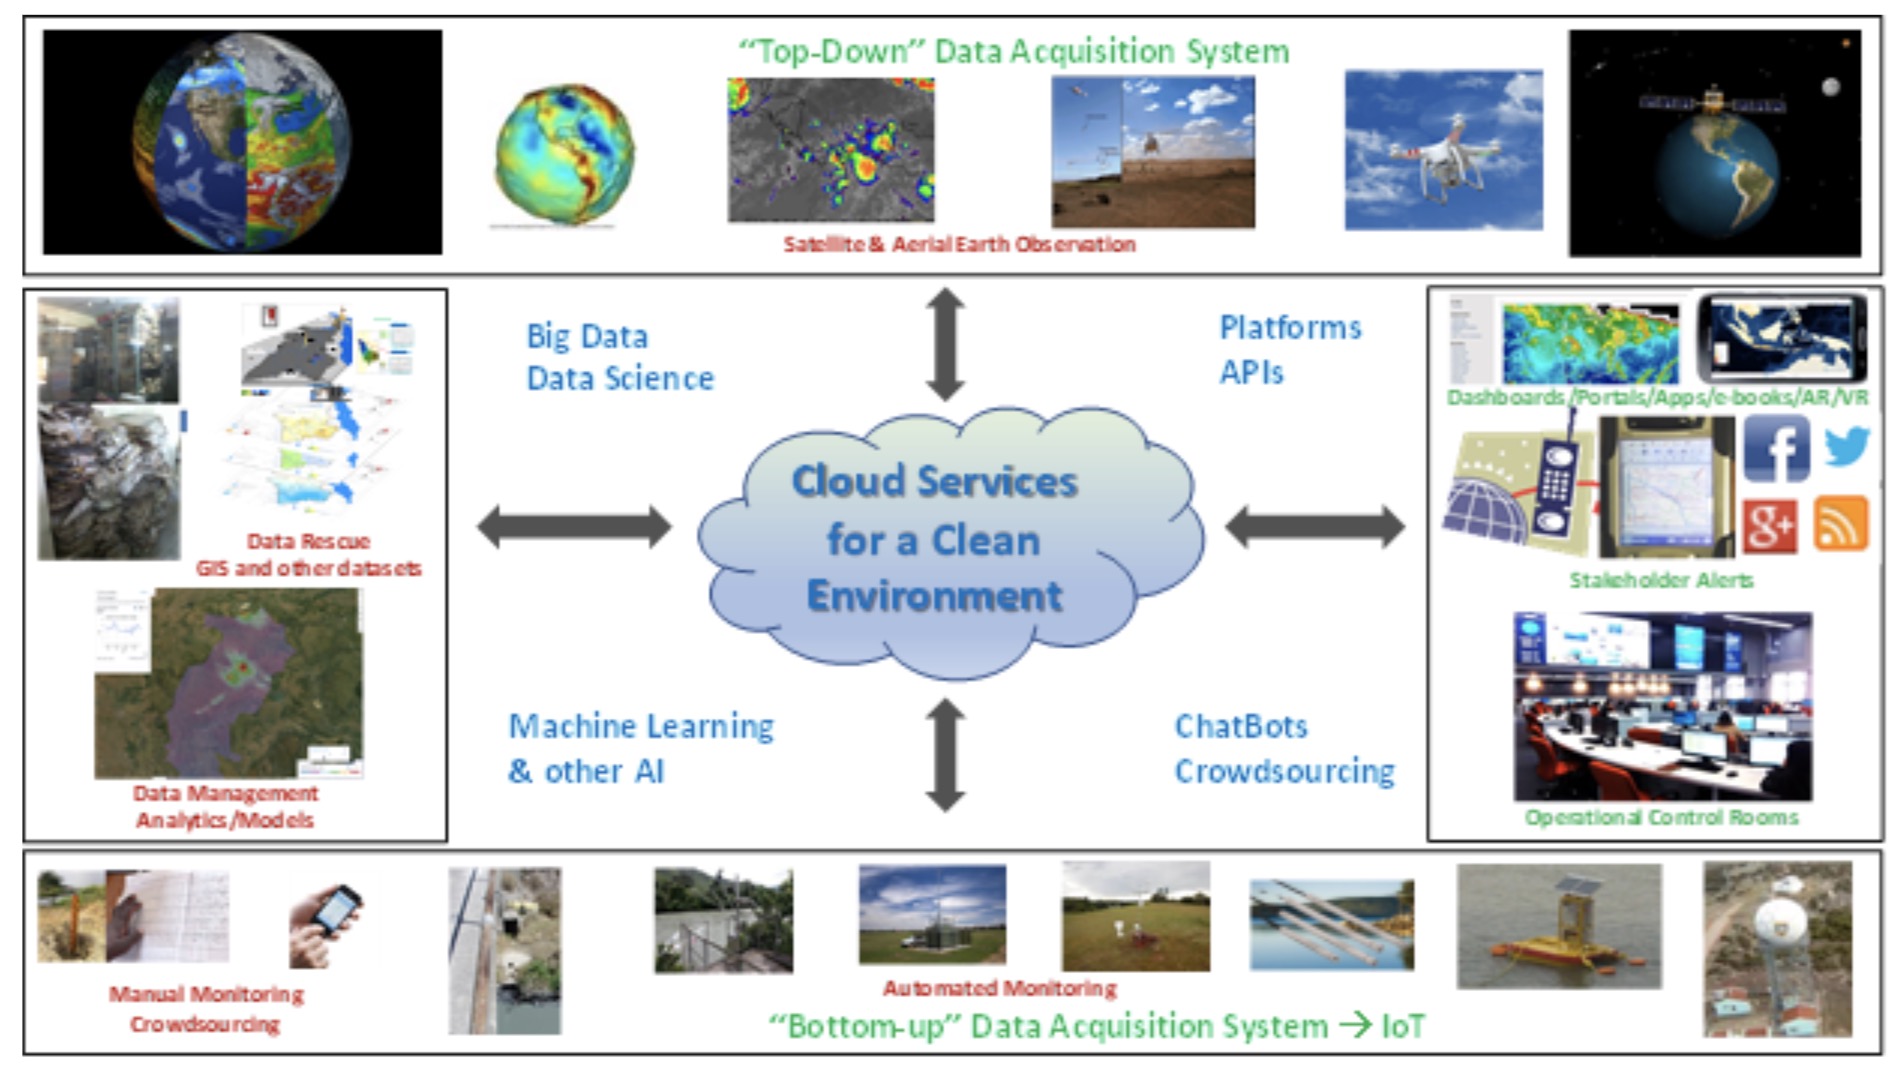
Integrated Air Quality Information & Analytics
There are increasing uses of modern data and analytics services to support more integrated decision making at all levels. These are being fueled by open data services and improvements in modern information technology.
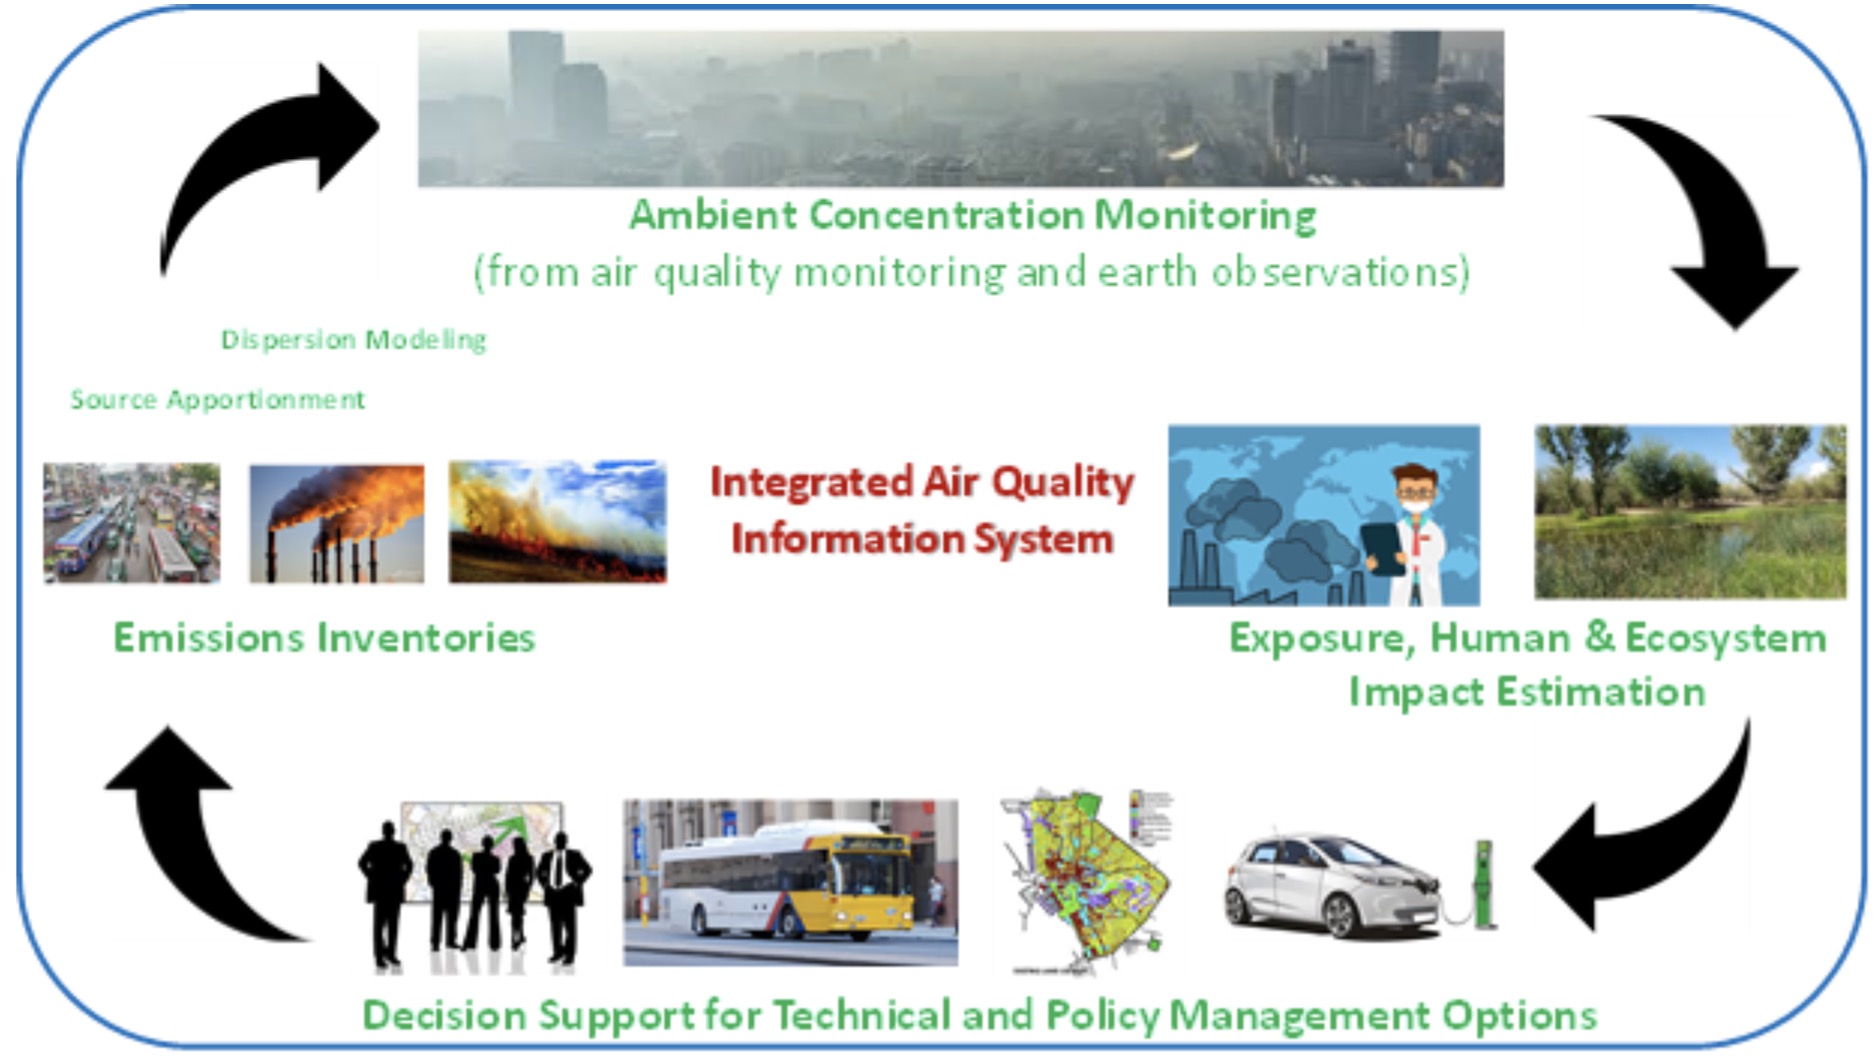
These systems can now be explored at various levels (e.g. global to city airshed) to better understand the pollutant emissions, concentrations, and health impacts from exposure and the technical and policy management options for decision making.
These are empowered by a range of earth observation data and global modeling tools that are largely free and a new range of subscription services (see ClimaCell as an example) that can help develop customized data and analytics platforms (see UrbanEmissions as an example).
These can be combined in appropriate dashboards to allow users to explore the data and undertake complex analytics and leveraging a new world of interactive visualization. See an example of using Sentinel 5P data for a month analyzed by Google Earth Engine to pinpoint poor air quality in the industrial heartland of India (e.g. the city of Korba in Chhattisgarh) and visualized using an open source based World Bank Geospatial Platform, where the pollutant estimates are overlaid over high resolution satellites maps to see the coal-fired power plants causing this pollution.
Green Horizons
To lower pollution levels and fight climate change, Internet of things (IoT) and Artificial Intelligence (AI) are being used to predict, identify, and track pollutant sources. In Beijing China where Breathing Beijing’s air, according to a study released last year by U.S.-based nonprofit Berkeley Earth, is comparable to smoking 30 cigarettes a day. The government has partnered with IBM
to in 2014, as part of IBM’s Green Horizons Initiative , the factors that contribute to the air pollution levels, such as traffic levels, weather, humidity, and wind patterns are collected from weather monitoring stations, satellites, and terrain maps by connected sensors, placed all over Beijing. The large volumes of data collected is analyzed with AI, along with historical data to predict the air pollution levels and patterns, the data is also used to inform measures to reduce the pollution. "Blue sky” days in Beijing increased and pollutants fell by 35 percent from 2012 to 2017—a success that has led to the expansion of the initiative into other cities in China, India, and South Africa.
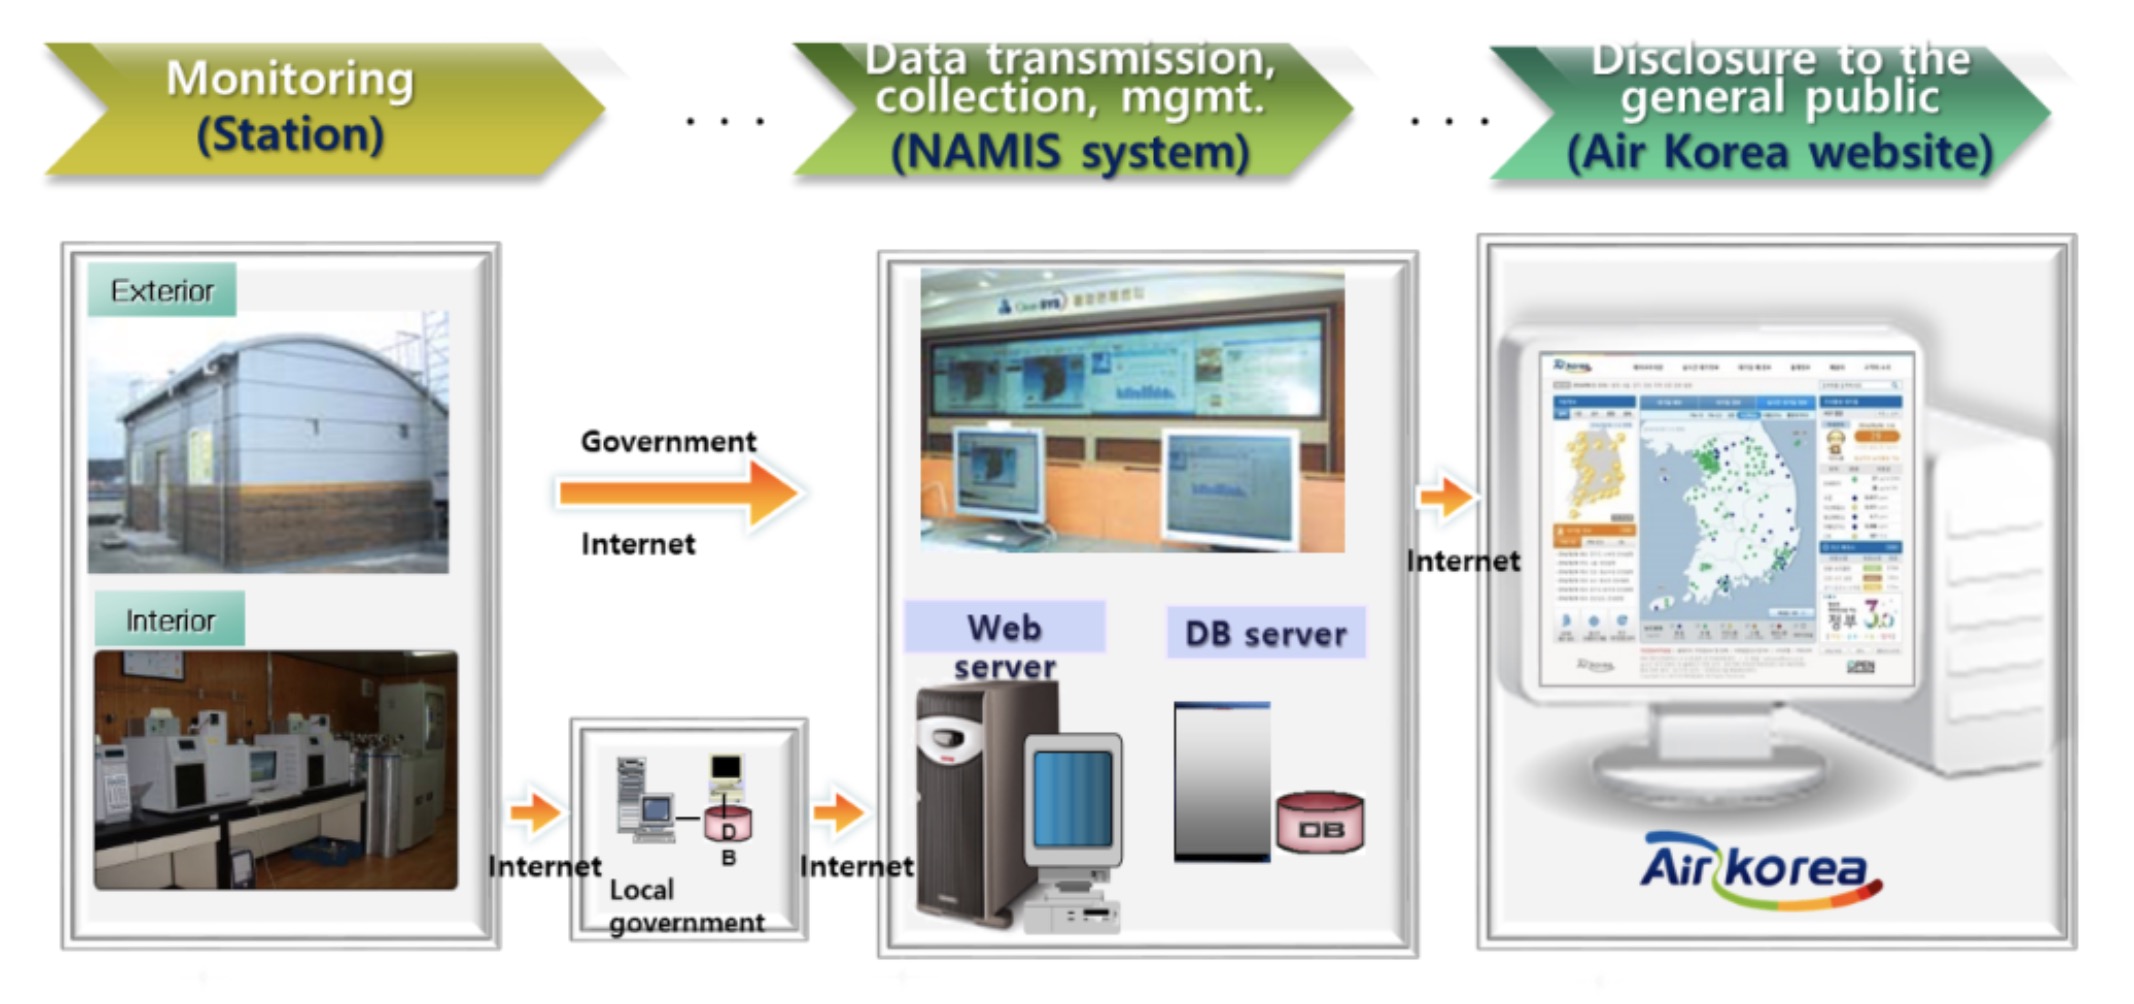
Air Korea: Real Time Air Quality Monitoring System
Air pollution in Korea has become an increasing concern to people and the environment as Korea has experienced rapid industrialization, especially in Seoul. In response to increased air pollution, The Korean government operates a real-time air quality monitoring and forecast system to reduce air pollutants that are toxic and hazardous to humans.
The government established the national air pollution monitoring network based on 584 stations (in 2018) throughout the country. It monitors general pollutants such as SO2, NO2, CO, O3, PM10, PM2.5 and hazardous air pollutants such as PAHs, VOCs, acid precipitations. It also monitors weather factors such as wind direction, speed, temperature, humidity, solar radiation and the UV radiation once every hour. It monitors the status of ambient air pollution and whether air quality standards are being met. The data on air pollution is stored in the National Ambient Air Monitoring System (NAMIS) and disseminated through ‘Air Korea’ which is an online air quality data sharing platform, so that public can access real-time air quality data around their neighborhoods.
The system also provides an air pollution warning for air pollution levels. Directly announcing ambient levels of air pollutants under high concentrations of pollutants like ozone and particulate matter, the system prevents and reduces damage by providing specific instructions for each alert level. It effectively notifies respiratory disease patients, the elderly, and children that are prone to harmful levels of air pollutants.
Source: KECO
Air quality monitoring around industrial complexes
A stack tele-monitoring system called Clean SYS was also developed by KECO to encourage business operators to voluntarily control the emission of air pollutants and prevent air pollution accidents by monitoring concentrations of air pollutants around stacks in real-time using automatic stack measuring devices. It is targeted for large-scale air pollutant emission facilities like power plants, boilers, incinerators, etc., and if emissions are near or over the limit, facilities and local governments are immediately informed to take appropriate action.
In addition, SLC also operates air quality monitoring system around landfill areas. By detecting odor and fine dusts from the landfill site in real time, the air monitoring system identifies origins of odor generation and odor moving routes so that prompts can be taken before proliferating the environmental problem. Installed at the outlets of odor-generating facilities and key spots inside and outside of the landfill site, odor monitoring senses are in operation 24 hours every day.
-
Odor monitoring: twenty-two sensor stations installed inside and outside the landfill detect hydrogen sulfide, ammonia, VOCs, etc., identifying odor status and analyzing connections
-
Outlet Monitoring: Odor-emitting 7 outlets have 11 odor-detection sensor stations, monitoring the air quality surrounding outlets
-
Fine Dust Monitoring: Fine dust measuring instruments are installed at 8 spots in 4 landfill boundary places to reduce fugitive dust in surrounding areas, monitoring fine-dust levels within the landfill site and reinforcing their control
-
Odor Modeling: Odor modeling is performed to anticipate real-time odor distribution, analyze or trace back causes of odor.
Reducing Emissions
Over the years, several air pollution prevention technologies have been developed which can help prevent the adverse effects of air pollution on the environment and human health. Some of them include scrubbers, electrostatic precipitators, fabric filters, biofilters etc.
Since 1992, refineries across the world have been using wet scrubbing technology (scrubbers) to reduce flue gas emissions from the Fluid Catalytic Cracking Units (FCCUs) as wet scrubbing provides a relatively better option in terms of costs, reliability and flexibility compared to other emission control options. Electrostatic precipitators have been used in thermal power plants for many years and are again gaining significant traction for air pollution control. These precipitators are highly effective at reducing particle pollution and are primarily used to remove particles from waste gases across power stations and various other industrial facilities.
Improved cookstoves and ventilators have paved a way to help reduce indoor air pollution. Some of the examples are discussed below.
Indoor Air Pollution
Indoor air pollution is one of the most dangerous types of pollution. According to the WHO it is estimated that 3.8 million premature deaths are caused by exposure to smoke from cooking fires . The activities that require burning solid fuel (such as firewood, crop waste, dung, coal and other) such as cooking, and heating are the most common origin of household pollution. Usually, lower income households are more exposed to this threat and it is considered already by the WHO “the world largest single environmental risk”.
See below the Global Burden of Disease visualization by the Institute for Health Metrics and Evaluation (IHME) to see the Disability-Adjusted Life Years (DALY) attributable to Air Pollution in a global scale.
Reducing indoor air pollution through improved cookstoves
Traditionally, around 95% of Ugandans have relied on solid fuels (charcoal or wood) for cooking, which has led to large levels of CO2 emissions. The Ugandan Improved Cookstoves project has helped in addressing the problem through use of an improved cookstove. The improved cookstoves have reduced fuel usage by 36 percent and reduced exposure to health risks associated with traditional stoves, such as burns and indoor air pollution. Moreover, it can save families more than US $105 per year . The project reduces pressure on Uganda's forests and improves users' health.
At the international level, Global Alliance for Clean Cookstoves was established in 2010 with an aim to provide clean and efficient stoves and fuels to three billion people who live each day without it. Their current focus countries include India, China, Bangladesh, Kenya, Nigeria, Uganda and Ghana. There are also many national initiatives – for example the PM Uijwala Yojana aims to provide LPG connections to 80 million people by the end of 2020.
Studies indicate the high exposure of indoor air pollution in the developing world. Improved ventilation could play a significant role in reducing indoor air pollution. Perhaps small solar ventilators could become affordable for use even in huts where much of the world’s extreme poor live.
Reducing air pollution through Precision Agriculture
The process of precision agriculture involves optimized management of inputs (land, water, fertilizer, pesticides etc.) using data-based technologies including remote sensing, GPS, etc. to increase crop yields and profitability. This innovative way of agriculture helps in reducing the amount of fertilizer used, which has enormous benefits in terms of reductions of greenhouse gas emissions. For example, more than 90 percent of Nitrogen emissions in Europe are associated with agriculture . Through its Common Agricultural Policy (CAP), Europe has made provision for precision farming, a step which shall help the region in achieving nitrogen use efficiency and reducing its agricultural related emissions.
Following is the video explaining precision agriculture.
Technology for Managing Agricultural Burning
Problem: Delhi routinely ranks as having one of the worst air quality of any megacity globally.
There are many sources of air pollution in Delhi both generated within the city (e.g. Transport, Industry, Brick Kilns, Diesel Generators, Dust, Power Plants, etc.) and from sources outside (e.g. dust storms, biomass and fuel burning, etc.). One of the sources that can be significant in some winter months (e.g. 42% on some days ) during the rabi harvest is from stubble burning from the nearby states of Haryana and Punjab. The problem is associated with the harvest of grains - farmers set fire to the wheat and rice stubble that's left over to make room for the next planting.
New Innovations: Many innovations and technologies have shown promising signs which if scaled up can help to reduce this input to Delhi’s winter pollution- one of the examples is the startup RY Energies , which has help turned tons of stubble into high-quality biomass resources for free. The farmers' fields are cleared for free in return for the residue. This residue is processed in machines and then sold to power plants which then use it to generate electricity. So far, the startup has processed around 1200-tons of residue which has generated 1,085 MWh (megawatt per hour) renewable energy units and reduced 14,350 kilos of PM 2.5. A2P Energy is instead buying straw from farmers and processing it into a range of pellets that can be used as fuel, animals feed and to enrich soil.
Steps taken: Both the Punjab and Haryana state governments are also encouraging use of another innovation called Happy Seeder. Happy Seeder is a tractor-mounted machine that cuts the stubble, lifts it, sow seed for the next crop and then spread the cut stubble over the sown area which then acts as mulch. The study “Fields on fire: Alternatives to crop residue burning in India” found Happy Seeder as the most profitable and scalable residue management practice, reduce substantial environmental footprint of on-farm activities, and reduce greenhouse gas emissions per hectare by more than 78%. Though some progress has been made in this direction, but a lot needs to be done to scale it up for adoption the 2.5 million farmers involved in the rice-wheat cropping cycle in northwest India.
Emerging technologies and innovations: The Ministry of Environment, Government of India, has recently announced the use of another technological innovation , a straw decomposer developed by the Indian Council of Agricultural Research Pusa institute. The decomposer has the capacity to degrade paddy straws in the field and convert them into compost in a rapid manner. IKEA also launched a ‘Better Air Now’ initiative in 2018 to help procure stubble/straw from farmers and convert into a renewable material source for its new collection of products, FÖRÄNDRING. In addition, Pune scientists from Agharkar Research Institute (ARI) have developed an anaerobic fungi mixture from stubble which can then be mixed directly in the bio-digestors along with other farm waste to acquire manure.
Reducing Exposure
Vacuuming out air Pollution
There are some exploratory devices being used to reduce air pollution exposure – most of these are currently certainly eye-catching even if criticized for not being effective beyond small areas and diverting attention from fixing the problem of emissions at source. For instance, there have been several giant outdoor vacuum cleaners to filter smog in China, that transform the carbon filtered in the air to diamonds. This invention can suck in air from a 300-meter radius and up to a height of seven kilometers, enabling some 800,000 cubic meters of air to be treated in an hour, filtering out 100% of fine particles and 95% of ultra-fine particles. In addition, China is aiming big for its bike sharing market through a Rotterdam-based innovation- a smog free bicycle which not only ease traffic congestion but also cleans polluted air through a device mounted on the handlebars, giving a cyclist a breath of fresh air.


Ultraviolet Germicidal Irradiation (UVGI) technology
UVGI can be used to in a building’s HVAC system to improve indoor air quality and reduce health risks of its occupants. Major pollutants/contaminants in a building include carbon monoxide, nitrogen dioxide, and polycyclic aromatic hydrocarbons which can be cleaned using UVGI technology. Over the years, Genesis Air has installed close to 300 UVGI products in various facilities including office buildings, schools, airports, hospitals and restaurants to treat the above-mentioned pollutants, drastically and efficiently improving the indoor air quality.
UV-C kitchen exhaust systems: UV-C light breaks down the grease particles in the kitchen exhaust systems, through two processes of photolysis and ozonolysis. Remaining smaller particulate and vapor are then exposed to ultraviolet lights in the exhaust plenum.
Financing/Governance
Financing Technology
A trust fund for clean air was set up in 2012. Administered by Climate and Clean Air Coalition (CCAC) and hosted by UN Environment Program (UNEP), the trust fund supports 12 initiatives and is used for an array of projects such as allocation of US$ 850,000 to implement their global strategy to introduce low sulfur fuels and cleaner diesel vehicles. Another such example is the US$ 320,000 funding to develop a clean cooking finance mechanism in Nigeria. A Clean Air Fund is helping India’s healthcare workers become clean air champions through training them in air quality data and monitoring tools.
Clean Air Fund is helping India’s healthcare workers become clean air champions through training them in air quality data and monitoring tools.
Governance
In order to address air pollution issues, WHO member states in 2016 adopted a road map for an enhanced global response to address the adverse health effects of air pollution at the 69th World Health Assembly in 2016. Key focus of this roadmap is to expand the knowledge base about impacts of air pollution on health; Monitoring and reporting on health trends and air pollution-related targets; Raising awareness of health benefits associated with air pollution reduction measures; and Enhancing the health sector’s capacity.
UNECE Convention on Long-range Transboundary Air Pollution (LRTAP), since its establishment in 1979 has grown to consist 8 protocols to cut emissions for pollutants such as sulphur dioxide, nitrogen oxides, volatile organic compounds and particulate matter.
Mapping air quality is essential for making policy decisions and overall governance concerning air pollution control. One of the examples in this regard is UK based EarthSense, which provides high resolution map (MappAir) of air pollution from global scales down to street corners. The map is built using advanced cloud-based data inputs and use machine-learning to get the most accurate and reliable air quality data.
Local Perspectives
The problem of air quality appears to be getting worse around the world. Many cities such as Los Angeles, Bangkok and others have significantly improved their air quality, but the challenge remains persistent in cities like New Delhi. In China, there has been marked improvement of air quality in the Jingjinji region (Beijing, Hebei, Tianjin, Inner Mongolia, Shanxi, Henan and Shandong) which had the highest fine particulate levels in China in 2013-14 and were estimated to be responsible for about 69,000 premature deaths in 2012-13 in Hebei alone. The work, supported by the World Bank, leveraged technology for monitoring, analysis, and emission reduction.
In a city like Lagos in Nigeria (which by some estimates is projected to be the most populous megacity globally by the end of this century), the air quality challenges are significant, and actions are underway to address this issue.
This is also the case in Ghana, where air pollution is responsible for 8 percent of the total annual mortality in the country.
COVID and Air Pollution
Health impact: The latest challenge the world has faced has been the recent global pandemic. According to the WHO, COVID-19 is an infectious disease caused by a coronavirus called SARS-CoV-2 which is a respiratory pathogen. Many studies are coming out that explore the connection between Air Pollution and higher COVID-19 death rates. A recent study from Harvard found that someone living in an area of high particulate pollution is 8% more likely to die from COVID-19 than others living in an area of just one small unit less of pollution. This and other studies suggest that small increases in long-term exposure to pollution causes larger increases in the COVID-19 death rate.
Air pollution, as it has been already discussed, is linked to multiple health problems in the long-term including cancer, heart disease, stroke, diabetes, asthma and other co-morbidities. All of these are also underlying medical conditions that can worsen the illness with COVID-19.
An article from The Lancet addresses the same idea but from a different perspective. The Comment examines the link between reduced emissions due to strict lockdowns and the cause-specific mortality during the large-scale quarantine, suggesting that interventions to contain the COVID-19 outbreak in China led to improvements in air quality that brought health benefits in non-COVID-19 deaths.

Air pollution levels and avoided cause-specific deaths during the COVID-19 outbreak in China
(A) The coronavirus disease 2019 (COVID-19) epidemic curve and quarantine timeline in Wuhan, Hubei province (outside of Wuhan), and China (outside of Hubei) from Jan 5 to March 14, 2020. New confirmed cases of COVID-19 were reported by the National Health Commission of China. (B) Daily nitrogen dioxide and PM2·5 concentrations from 20 days before the Chinese New Year and 50 days after the Chinese New Year in 2020 (blue line) and 2016–2019 (grey line). (C) The mean nitrogen dioxide tropospheric column density before and during the quarantine period in 2020. (D) The reduction in cause-specific deaths in China due to a decrease in air pollution during quarantine.
Air pollution reduction and mortality benefit during the COVID-19 outbreak in China. © 2020 Kai Chen, Meng Wang, Conghong Huang, Patrick L Kinney, Paul T Anastas. Published by Elsevier Ltd.
Environmental impact: Following the outbreak of COVID-19 in February 2020, countries around the world have enforced lockdowns and curfews of varying degrees, ranging from total movement control to partial restrictions based on time. These worldwide measures resulted in movement restrictions and a significant slowdown of many industries and caused many regions to experience a large drop in air pollution.
Pollution monitoring satellites from NASA and European Space Agency have detected significant decreases in concentrations of some of the most prominent pollutants emitted by motor vehicles, power plants and industrial facilities. In some areas, concentrations have decreased by around 40% owing to nationwide quarantines.
Below an image from the Copernicus Sentinel-5P Mapping Portal developed by the European Spatial Agency showcasing tropospheric NO2 concentrations averaged over 14 days in two different time periods.
Sentinel-5 Air Pollution Data (click to access Portal)
Another interesting tool developed by the European Space Agency (ESA), Japan Aerospace Exploration Agency (JAXA), and National Aeronautics and Space Administration (NASA) is the tri-agency COVID-19 Dashboard. The dashboard combines the resources, technical knowledge and expertise of the three partner agencies to strengthen the global understanding of the environmental and economic effects of the COVID-19 pandemic.
Clean Fuel
Ontario based Pond Technologies has come up with a technology to convert carbon emissions from factories into cleaner biofuel for vehicles through use of algae. The technology if put into use across the North America can save greater than 100,000 tons of emissions of CO2 per year and 30% of the diesel use can be offset by algae-produced biodiesel annually. Many of these investments could also have co-benefits in terms of local air pollutants as well as potentially displacing more polluting systems.
In summary, air pollution is an important negative externality of both modern and traditional (e.g. indoor air quality) living that particularly impact the poor due to higher exposure to higher levels especially of fine particulates. Technology is starting to show new ways in which this issue can be addressed in innovative ways that will benefit from improved knowledge sharing of global good practices as they emerge. The next section explores the impact of pollution on water - another critical natural resource.