The approach to measure and model sediment depends on factors such as the size of area for instance a farm plot or an entire river basin or specific concern – agricultural run-off or reservoir sedimentation. The most common source of erosion is water erosion and the tools to measure water erosion are the most developed and standardized. Models to measure wind and tillage erosion also exist, however are not covered under this note.
While direct measurements of water erosion in the field - like measurements of rill and gully depth or amount of sediment in drains- can be relevant to farmers and be applied with less investments in smaller areas, for larger areas such as a river basin more advanced methods using remote sensing and application of model-based approximations need to be used.
The tools used to measure erosion and sediment loss at a water-shed or basin scale can include any of the following used individually or in combination with each other:
- Sediment Loss and Transport Models
- Sediment Yield from Catchments
- Remote Sensing
- Geospatial Imagery and Digital Elevation Models (DEMs)
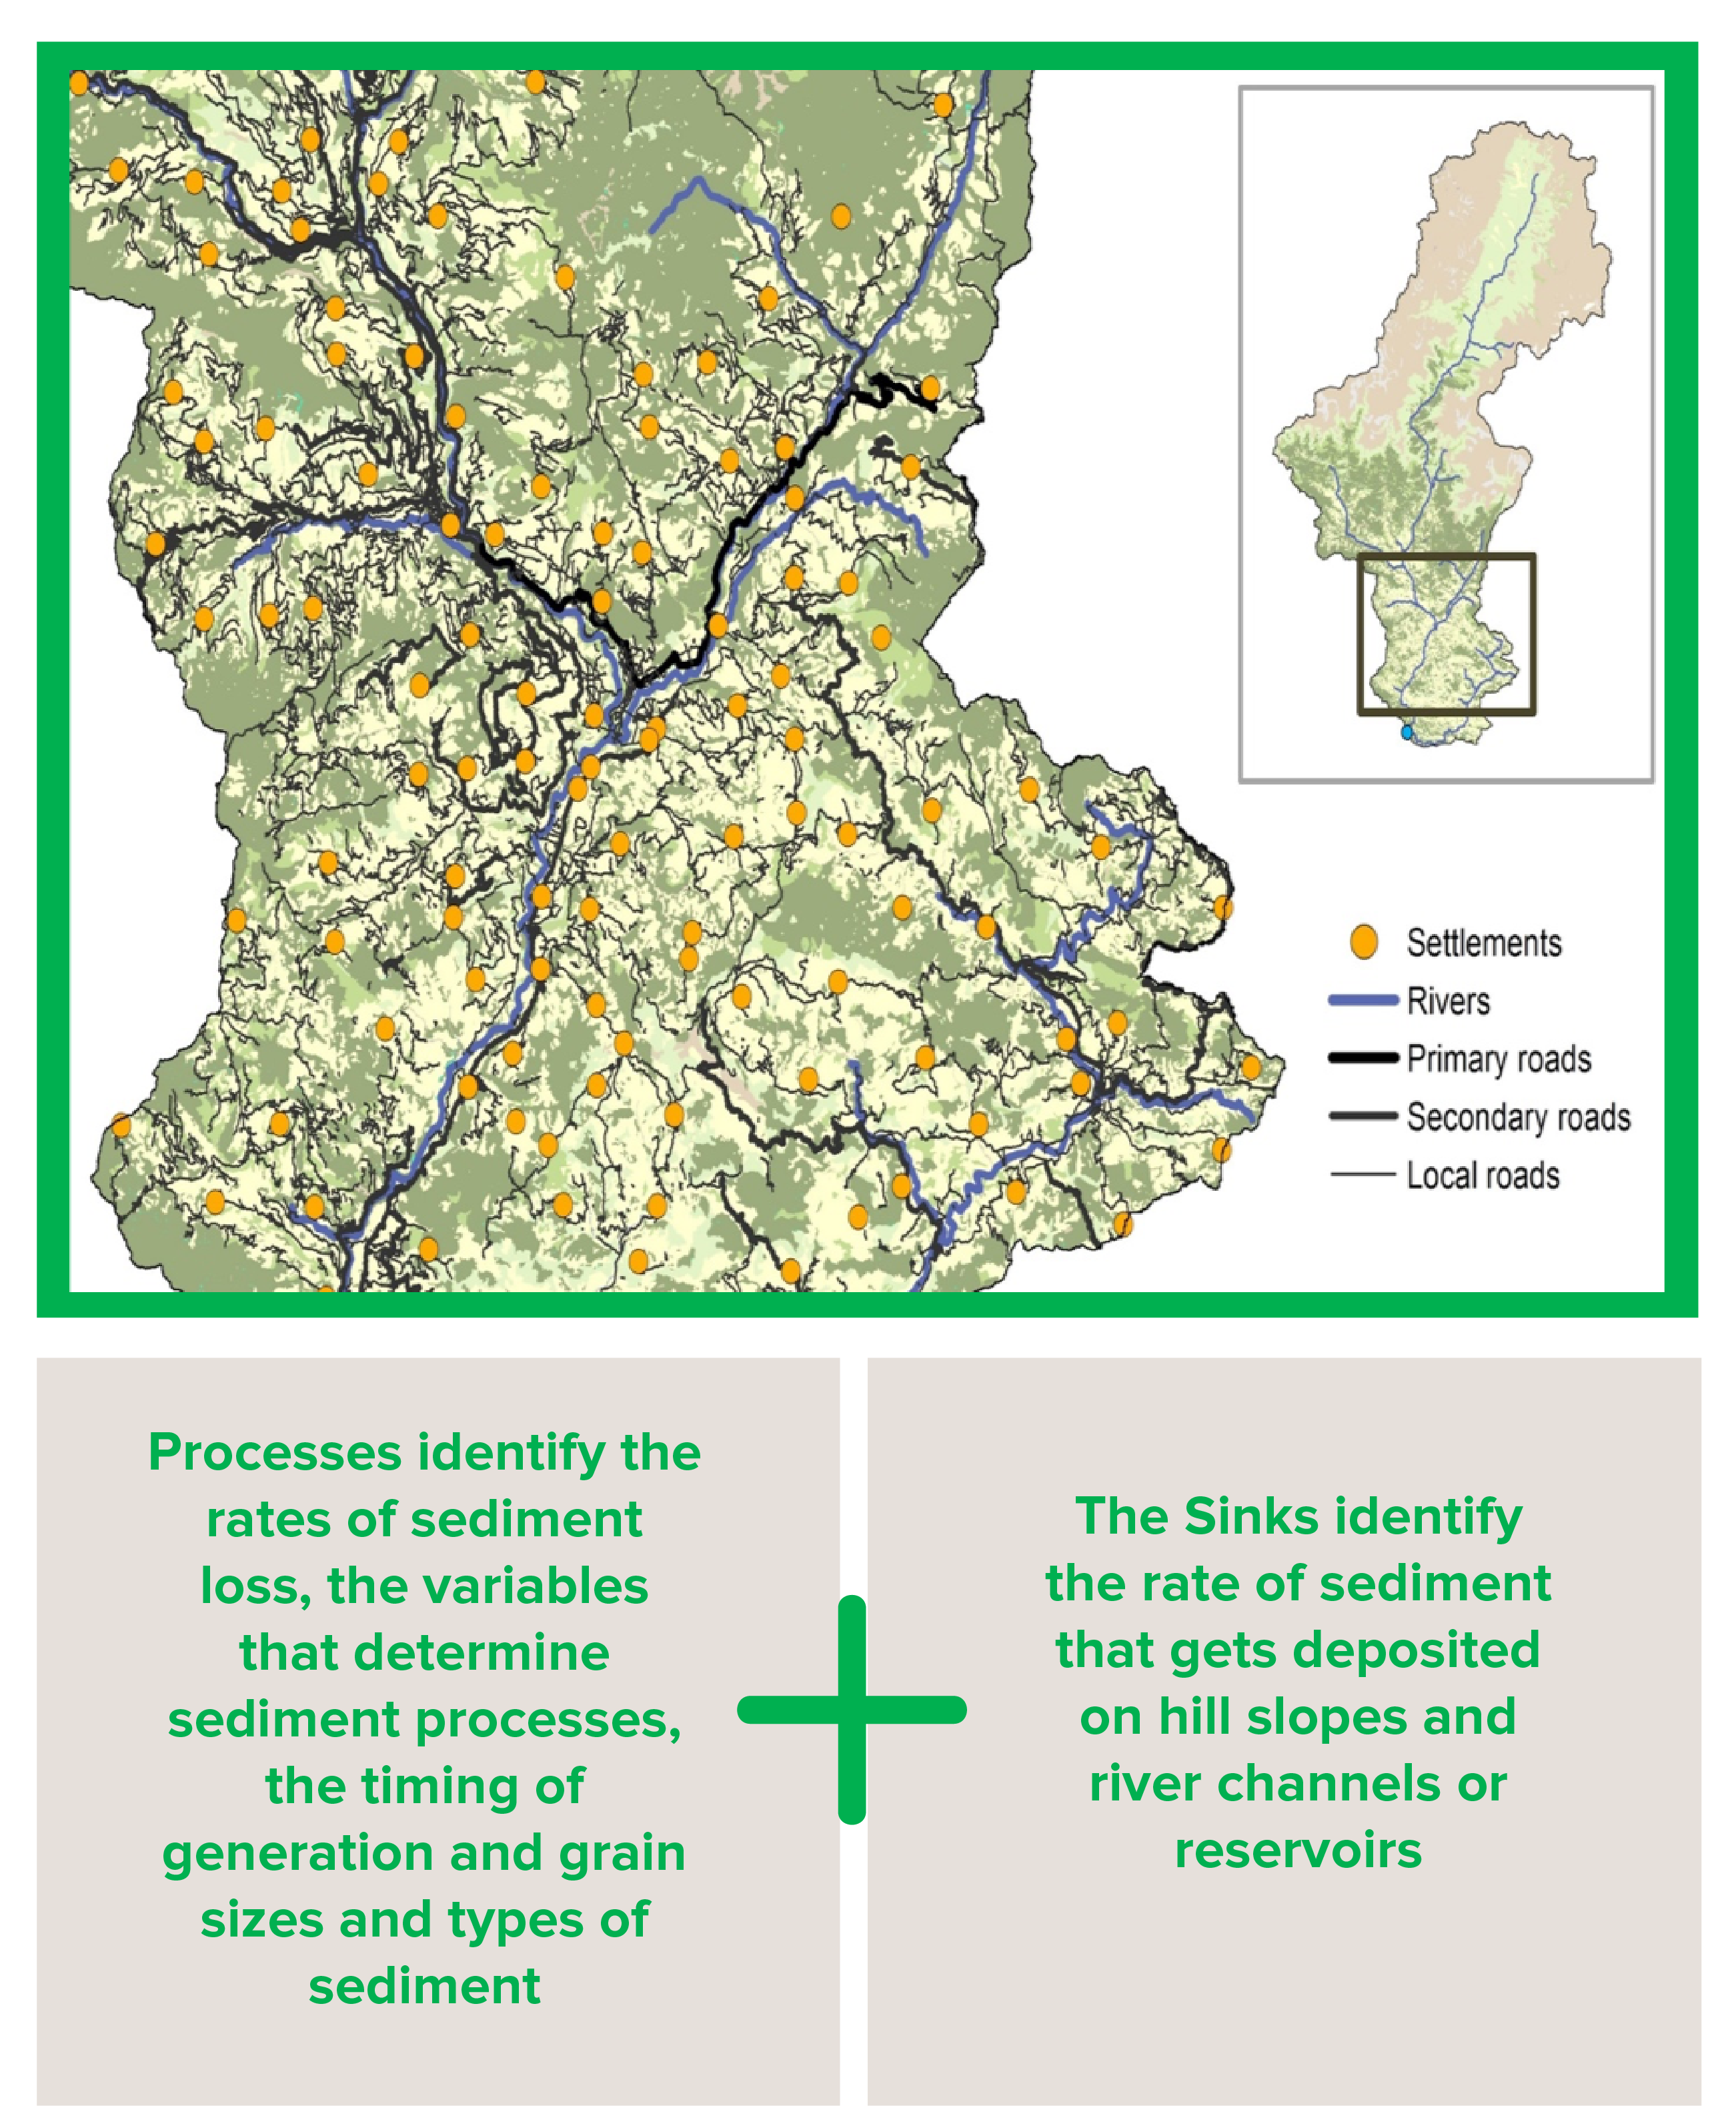
Sediment Loss and Transport Models
Erosion and sediment loss models have been developed based on the results of rainfall simulator studies and the use of experimental erosion run off plots (FAO, 2019).
- Rainfall simulators study the detachment of soil by raindrops; in simulated conditions, by varying the drop size and intensity of rainfall through nozzles, one can understand the impact of different precipitation events on different soil surface conditions.
- Erosion-runoff plots are sized at 22.1 m long and 4.1 m wide and have instruments located at the base of the plot where runoff and sediment can be captured and measured. Erosion plots can also be reliably used to assess the effect of management (such as tillage and cover) on soil loss.
Both the above studies were extensively used to develop the Universal Soil Loss Equation (USLE), one of the most widely used mathematical models to understand erosion processes. In the development of the first version of the USLE over 10,000 annual records from plots and small catchments were analyzed to develop the empirical relationships embodied in the equation (FAO, 2019). The USLE, developed in the US in the 1930s, was revised in 1993 to incorporate more advanced computerization and improved calculations leading to the Revised University Soil Loss Equation (RUSLE). Subsequently several other models have been developed based on similar principles but adapted on one or more parameters to account for improved data availability, differences in local geographic conditions or other specific requirements of the geographical area.
Sediment Yield from Catchments
Tools can also measure the water flow and suspended sediment concentration from catchments and river basins. Gauging stations are installed along a stream or river channel and devices measure the suspended sediment load of the water at set time intervals. Sediment yield at the measurement point is expressed as the mass of sediment per area of the catchment for a given time period (for example, tonnes per square kilometer per year or t km-2 yr-1). This method can be used in combination with gross estimates of erosion rates in the catchment to calculate the ratio delivered at the basin outlet to gross erosion within the basin – known as the sediment delivery ratio. The limitations of using this tool in isolation are: i) The sediment measured at the outlet is only a fraction of that actually eroded in the catchment, ii) sediment on hillslopes and along river courses causes a time lag between erosion in the catchment and sediment measurement and iii) the sediment transported in the river is derived from sources other than hillslope erosion (FAO, 2019)
Remote Sensing Technology
Remote sensing is increasingly being used a tool to facilitate field assessments of erosion, especially to understand rill and gully formation and may in the future supplant the use of model-based approximations of sediment loss, by measuring erosion using change detection through measurements like Light detection and range (LIDAR) and close-range photogrammetry through repeated surveys.
Geospatial Imagery and Digital Elevation Models (DEMs)
GIS and DEMs are key sources of information to establish the boundaries of the basin, land-use land cover. They are integral to the process of sediment modelling as the process is best viewed on a GIS platform such as ArcGIS or QGIS. Sediment models use input data such as GIS data, Land use Land Cover Maps and information in tables - to present outputs such as the sediment load delivered to the stream and sediment retained by vegetation and topographic features.