Bottom-up Mechanisms
There are several mechanisms to collect data on the ground, including through sensors (e.g., in installed in situ gauges and portable monitoring systems), surveys (e.g., from aerial, heliborne, or drone-based surveys – e.g., for detailed elevation or geophysical aspects), and crowdsourcing (e.g., through phone apps).
In-Situ Monitoring
There are an ever-evolving set of monitoring instrumentation to help estimate various parts of the hydrologic cycle and associated parameters (e.g. weather, surface and ground water levels and quality, soil moisture, etc.). Some of these (e.g. 3D-PAWS) also use innovative low-cost 3D printed housing to reduce costs in some cases. Data transfer is moving from legacy manual systems to dataloggers to now near real-time telemetry (ranging from using broadband to GSM to satellite depending on the situation). It is expected that billions of sensors will be integrated into many devices leading to an Internet of Things (IoT) – going from an estimated 8.74 billion devices in 2020 to over 25 billion IoT devices a decade later. Countries around the world are scaling-up the use of such sensors in the public and private sector.
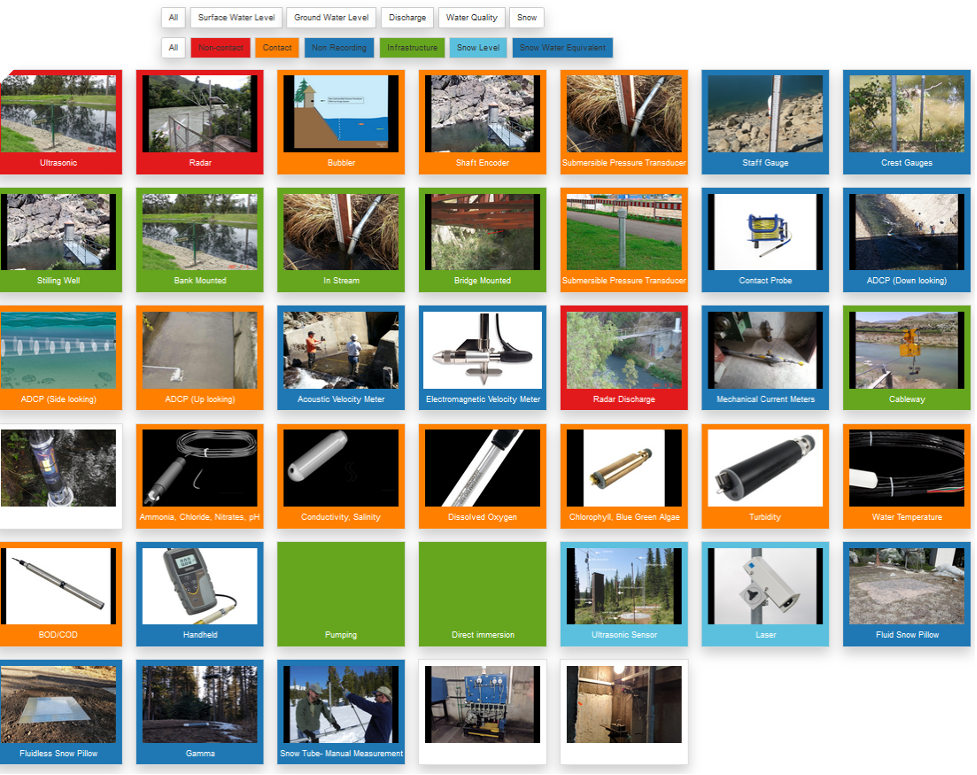
These are accessible using the interactive tool below.
The monitoring systems of particular relevance to Bhutan are described below:
Precipitation Measurement
Description: The tipping bucket rain gauge is ideally suited for automatic rainfall measurement since the tipping bucket mechanism relies on the weighing of liquid water. The tipping bucket rain gauge operation starts with rain entering the orifice (usually an area of 200 to 500 cm2). The rain drains through a funnel which allows the rain to fill one of two buckets. When a bucket fills to a set weight of water, the bucket empties (tips) while simultaneously moving the other bucket in place. The process repeats itself, with buckets filling and tipping (emptying). The volume of water captured by a single bucket can be as small as 0.1 mm of equivalent rainfall. The tipping bucket rain gauge is generally not suitable for frozen precipitation, though some units are equipped with heaters that continuously melt snow that enters the orifice. Heated tipping buckets come with their own set of challenges, such as evaporating precipitation if the heat is too high or not melting the snow if the heat is too low. There are also problems with a heat chimney effect, which can deflect snow away from entering the orifice. Tipping bucket rain gauges require regular maintenance and calibration. The funnel must be kept clear of debris, and insects need to be kept out of the gauge body. Calibration can be performed as infrequently as once/year, while general maintenance (cleaning) should occur quarterly. Calibration should be performed just prior to the rainy season.
Cost: $500 - $1,000 USD
Specifications: The tipping bucket rain gauge should be composed of corrosion resistant powder coated metal or stainless steel. The tipping bucket mechanism should include dual-reed switches. The construction of the gauge should allow the calibration of the tipping bucket mechanism without removing the tipping buckets. All openings are to be protected by screens to prevent insects from gaining access to the tipping bucket mechanism. Orifice to be 200 to 500 cm2. Tipping bucket resolution 0.1 mm.
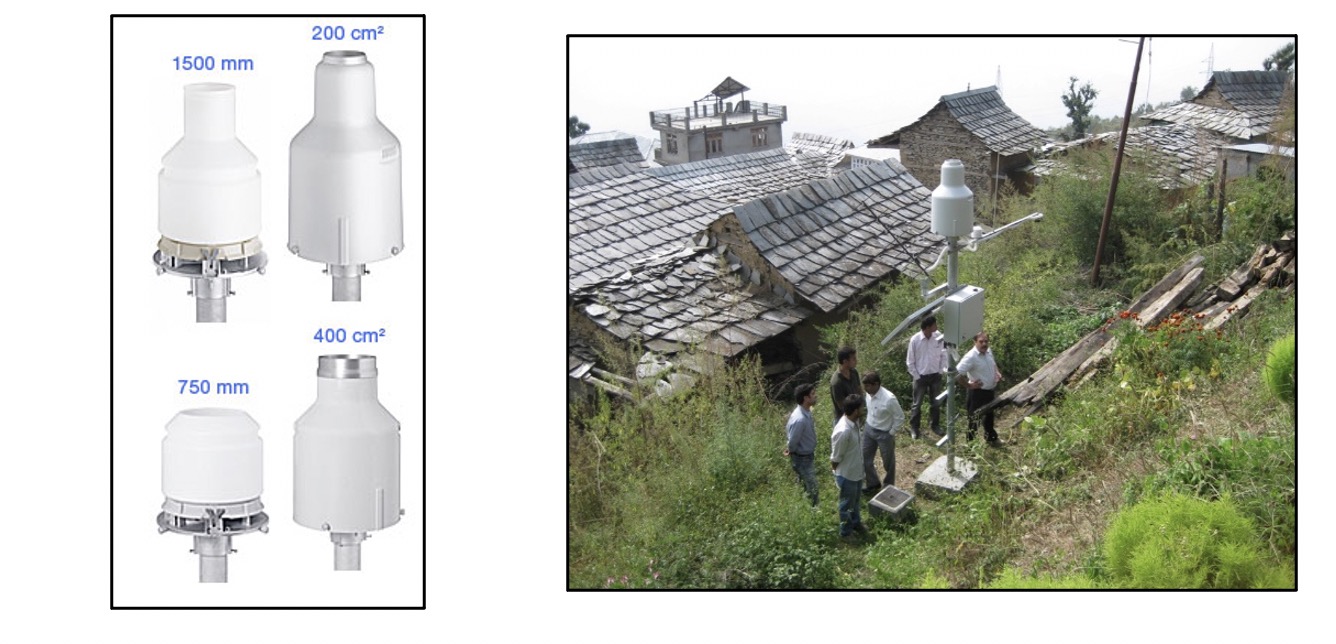
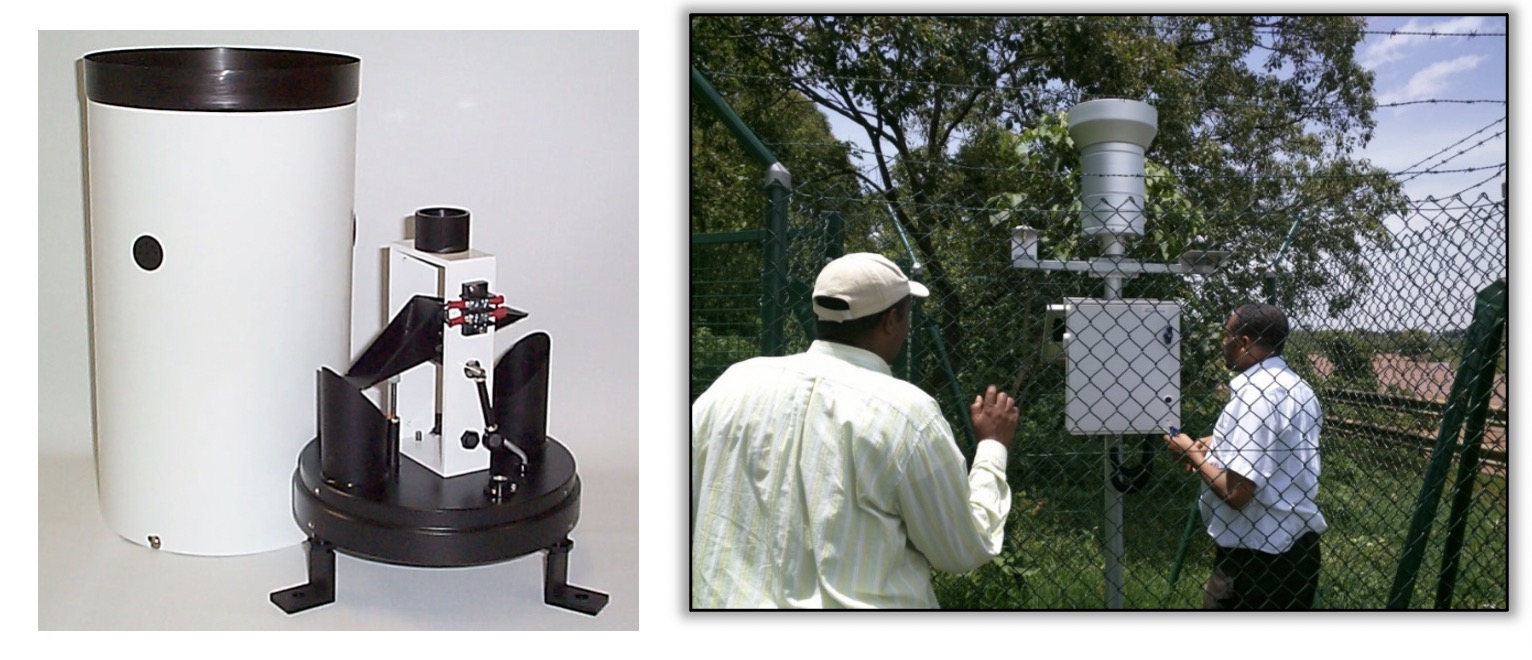
Description: While the tipping bucket rain gauge is most suitable for rain, a storage gauge can measure frozen precipitation as well as rainfall. The storage precipitation gauge is a more expensive and more accurate method of measuring precipitation than the tipping bucket gauge. As precipitation is collected in the storage gauge, the water is collected in a bucket and continuously weighed. For mixed phase and frozen precipitation, antifreeze solution is placed in the bucket to prevent the water from freezing. The antifreeze mixture commonly used is propylene glycol mixture with alcohol. Propylene glycol is generally harmless to the environment and a significant improvement to legacy antifreeze used, containing ethylene glycol.
The storage precipitation gauge is susceptible to measurement errors caused by frozen precipitation bridging over the opening; thus, a large orifice (catch area) is desirable. Storage gauges can hold 1500 mm of liquid equivalent precipitation, which is a large enough capacity to last the entire winter in most locations. If the precipitation exceeds the gauge capacity, then the gauge must be maintained by emptying the bucket and adding a new initial charge of antifreeze.
Cost: $2,500 - $4,000 USD
Specifications: Capacity of 1500 mm (or as needed). Orifice size 400 cm2 minimum. Sensor: Sealed load cell. Power supply 12V nominal. Accuracy +/- 0.05 mm. SDI-12 or RS-485 (make sure the DCP is compatible with the signal being specified.
Snow Measurement
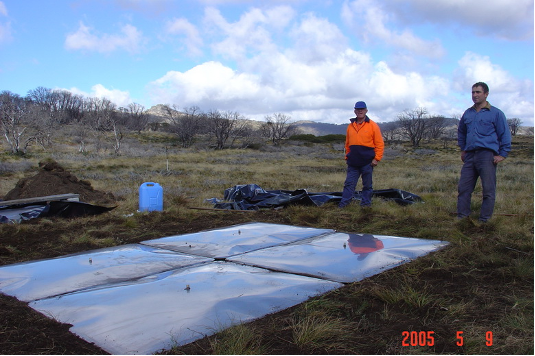
Description: Snow pillows are made from either stainless steel or synthetic rubber containing antifreeze solution. Multiple snow pillows can be installed together to increase the measurement surface area of the snow pillow. As the snow accumulates on the pillows, pressure is exerted on the pillow. This pressure is measured by a pressure transducer that is typically stored away from the snow pillow in a protected environment such as an enclosure or housing. Knowing the surface area of the pillow and the pressure exerted by the snow, the sensor converts the data to snow water equivalent (SWE). The installation of the procedure is more labor intensive than other SWE measurement devices. Antifreeze must be brought in to fill the pillows and significant preparation work is required to ensure the pillow is level with the ground.
Snow pillows can be prone to damage by wildlife. This damage often leads to the pillow leaking, leading to the loss of the antifreeze. The snow pillow that uses antifreeze is provided to general information. When measuring SWE, it is advised that the Fluidless Snow Pillow (FSP) be used or the cosmic ray detector, which take less maintenance and yield similar or more accurate measurements.
Cost: $3,000 USD with transducer
Specifications: A snow pillow will be made up of four flat compressible tanks that will hold an antifreeze mixture. The four compressible tanks will be plumbed together. Each tank will measure at least 150 cm by 120 cm for a total coverage of 3 m by 2.4 m. The snow pillow will be plumbed into a pressure transducer to measure the amount of pressure being exerted on the pillow.
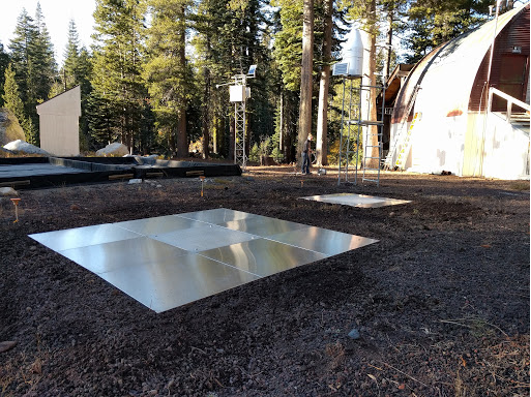
Description: The FSP design is adopted from the legacy snow pillow that employs stainless steel bladders. The FSP uses a number of load cells (strain gauges) that measure the weight of the measurement panel. The picture above shows two different configurations, with a larger 9 m2 area system in the fore ground and a smaller 2.6 m2 area system in the background. The measuring area on both systems is made on the center plate (measurement panel), which is 1 m2. The center plate in the picture above has a different sheen to the plate. The side panel surfaces are intended to eliminate lateral forces of the resting snowpack, to not impact the center panel. Instructions provided by the vendor on proper installation should be closely followed, including typical siting and FSP support infrastructure, which is modest.
Electronic cabling connects the FSP to DCP. The construction material of the plates is aluminum of sufficient thickness to prevent deflection, bending, or damage under maximum snow loads. It is advisable that the FSP system be made up of a minimum of four load cells, with the capability for each load cell to be individually monitored by the DCP. This will allow the operator to see the variation of weight being applied to each load cell and determine the “health” of each load cell.
Cost: $8,000 USD.
Specifications: Aluminum panels, providing a total surface area of at least 2.6 m2, with the center panel being at least 1 m2. The technology will use load cells (strain gauges), which will consist of 4 load cells supporting the center panel. No single plate shall be larger than 1 m2 which will enable the FSP components to be more easily transported to the installation site. The output signal of the FSP will be SDI-12, or other output as supported by the accompanying DCP.

Description: The Cosmic Ray Detector (CRD) represents a new technology used to measure SWE. The CRD was built to overcome the measurement problems of snow pillows. The CRD operates on the principle of measuring the number of cosmic rays reaching the scintillator which is enclosed in the metal containers pictured above. The picture shows a test of four different CRDs to determine the smallest size of a CRD needed to adequately measure SWE.
The theory of CRD in the measurement of SWE is that cosmic rays are attenuated by water, either in vapor, liquid or frozen form. The attenuation of cosmic rays is inversely proportional to the amount of water, such that the fewer cosmic rays detected the higher the water content. The CRD often includes two detectors, one mounted above the snowpack, and the other mounted beneath the snowpack, such that the difference in cosmic rays reaching the respective detector can be measured.
The CRD removes the nuances of snowpack microphysics, such as ice lenses that can interfere with snow pillow measurements as the ice lenses bear differentially on the supporting surface. Since the CRD doesn’t operate by the weight of the snow, the snowpack structure is not a factor in determining SWE, which leads to a more accurate measurement of SWE of the snow pillow concept.
Cost: $10,000 USD
Specifications: Technology should employ the detection and quantification of cosmic rays that will yield accuracy within 5% of snow tube measurements. The output should be supported by the ¬accompanying DCP. The DCP must be a widely distributed unit by a major manufacturer of meteorological equipment.
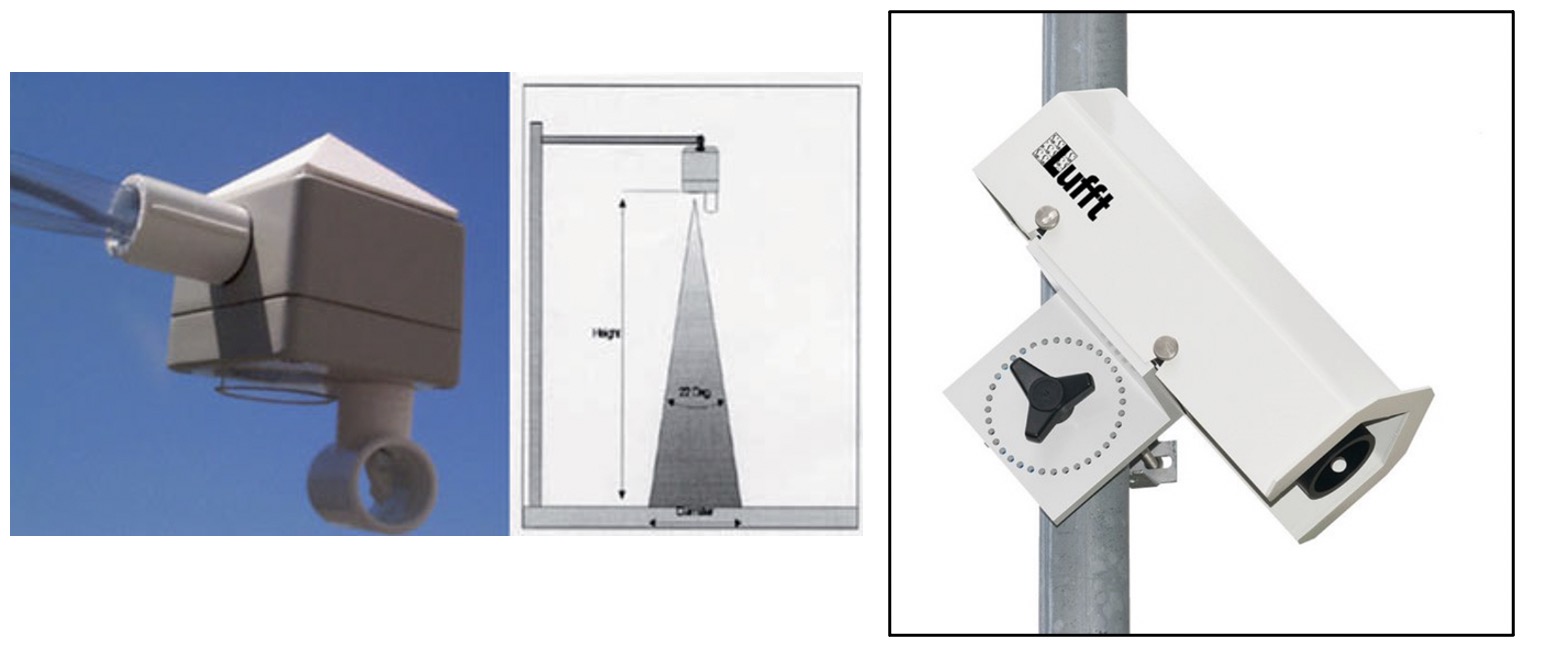
Description: Snow depth, when coupled with SWE, provides the overall density of the snowpack. Snow melt and runoff are closely tied to density of the snowpack. As the snowpack density increases, the snowpack becomes “ripe”, and runoff begins. This makes snow depth an important parameter in determining runoff.
There are two technologies commonly used in detecting snow depth. The first technology uses ultrasonic pulses, and the other technology utilizes a laser. Both sensors/transmitters are placed at a point higher than the greatest expected snow depth and measure the distance from the sensor to the top of snowpack. The ultrasonic sensor shown to the left of the picture above has a maximum range of 10 m, while the laser sensor shown to the right of the picture above has a range of 15 m.
One factor to consider in choosing between an ultrasonic and laser sensor is the electrical requirements. The laser system can be expected to take 3.4 W that includes a heater intended to prolong the life of the laser.
Cost: $1000 - $2,000 USD.
Specifications: Distance range: 1 - 10 m, Accuracy: ± 1 cm or .5 % of the target distance, Resolution: 1 mm. SDI-12 interface or as supported by the DCP.
Glacier
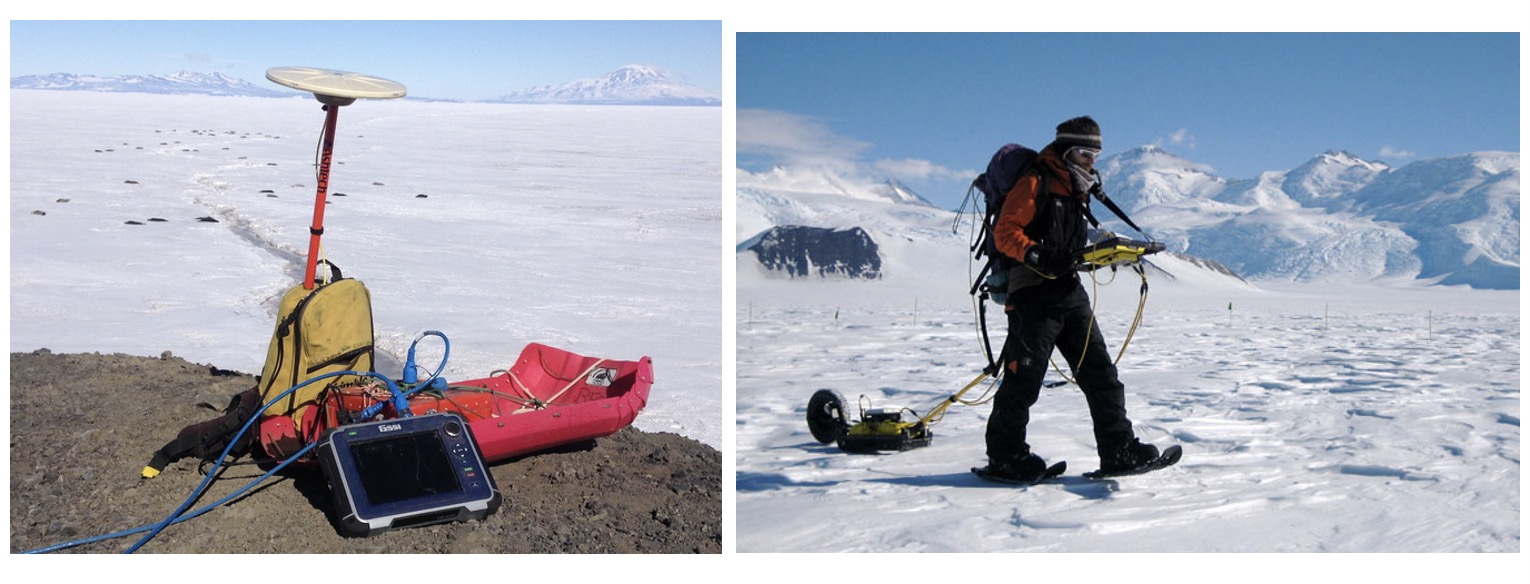
Description: Ground penetrating Radar (GPR) is a valuable tool for measuring the thickness of mountain glaciers. GPR has been part of a standard procedure for investigating thickness and internal structure of glaciers since the 1970’s. The practice of using GPR is labor intensive.
The basic principle of GPR is the transmission of a short electromagnetic pulse, with a specified frequency, down into the ground and the recording of reflected energy as a function of time, amplitude and phase.
The propagation of the electromagnetic waves is determined by material properties such as the electric permittivity, the electric conductivity and the magnetic permeability. If the electromagnetic wave velocity of the subsurface material is known the observed travel times to a reflector can be converted to depth. The dielectric constant of earth materials usually varies from 1 (air) to 80 (water) representing wave velocities of 0.3m/ns (air) and 0.03m/ns (water). For subsurface materials in glacial and periglacial environment values of 0.09-0.11 (moraine), 0.10-0.14 (loose debris), 0.11-0.13 (granite) and 0.16 – 0.17 (glacier ice) are found. This is the underlying science to GPR.
The picture above shows a GPR with sled that would be walked over the glacier. The results of the measurements are a means of quantifying glacier structure and mass, which is used to track the evolution of the glacier.
Cost: $25,000 USD
Specifications: Number of channels: 1 single-frequency antenna or 1 dual-frequency antenna, Scan interval: User selectable, up to 400 scans/sec, Number of samples per scan: 256, 12, 1024, 2048, 4096, 8192, Operating modes: Continuous (time) or survey wheel (distance triggered) or point mode. Operating temperature: -20 - 40 C, Battery: 3-hour runtime, Weight: 5 kg or less.
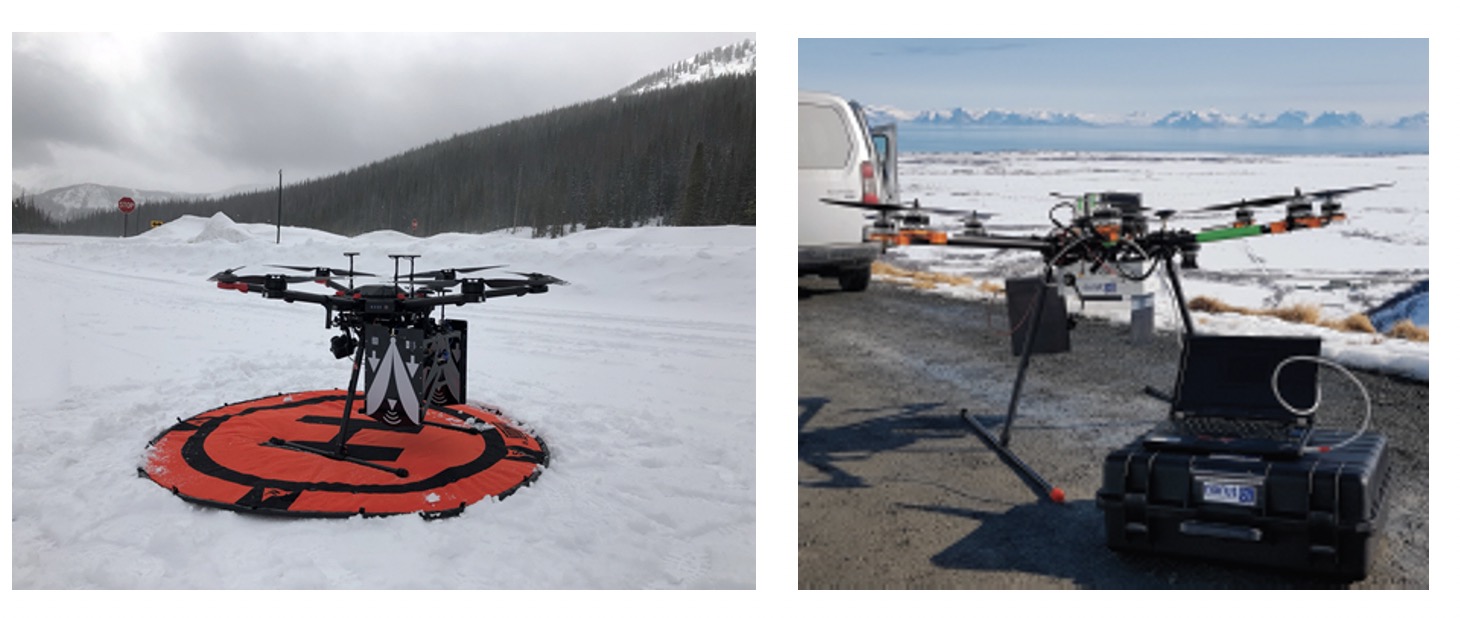
Description:The use of Unmanned Arial Vehicle’s (UAV) otherwise referred to as drones have gradually been applied to water resources management. One such application is the use of a UAV to measure snow depth using a high lift UAV capable of carrying a lidar system. The UAV system equipped with lidar is capable of measuring snow depth with 1 cm accuracy in open fields.
The upper left picture is a drone used by the USGS in developing snow measurements. The upper right picture is a UAV-borne radar system with the transmitting antenna (grey plate) and both receiving antenna’s (black plate) visible. Commercial drones are built with an 800 kg payload capacity with flight times of 30 minutes. Commercial fixed wing drones can fly for 5 hours with antennas to provide communication up to 60 km, though these are not a heavy payload UAVs.
There are many more applications for drones in water resources management which are still emerging.
Cost: $400 USD on up
Specifications: Dependent on the application, flight time, and payload.
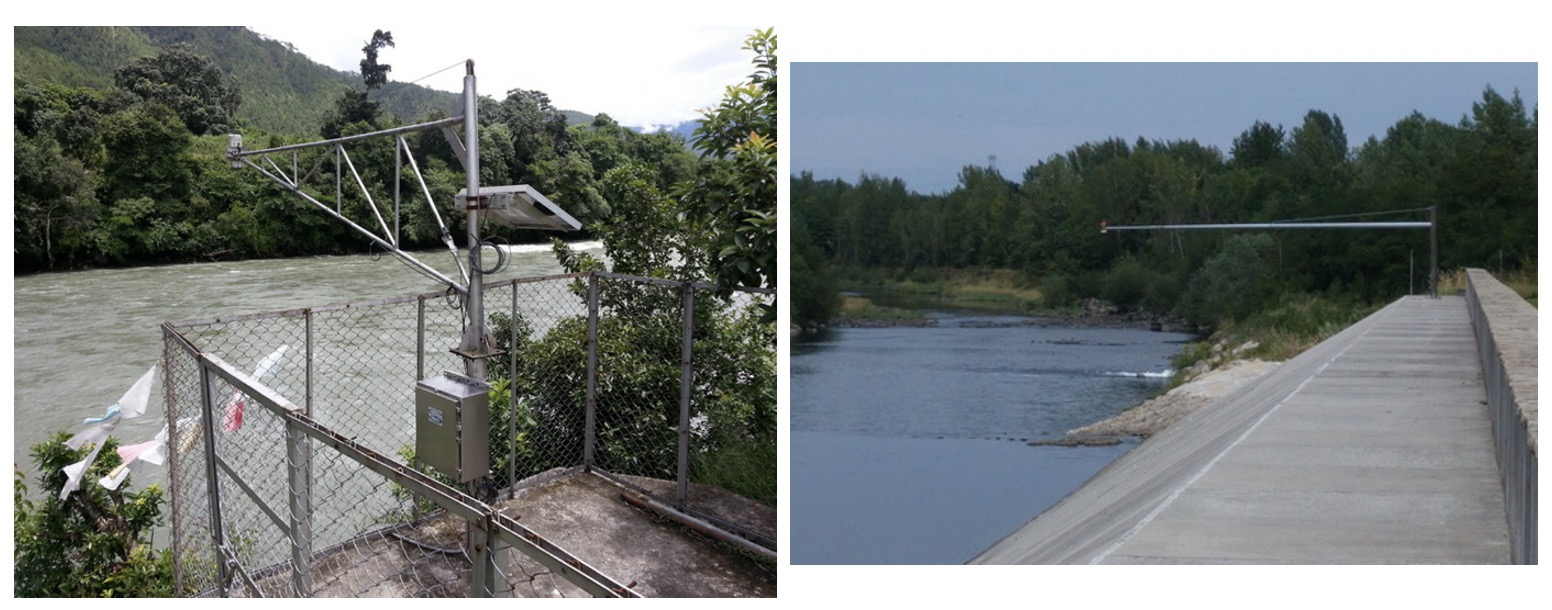
Description: Radar water level sensors are non-contact solutions that works by transmitting electromagnetic energy which is reflected by objects with high dialectic properties (such as water). Distance of measurement is calculated automatically by the radar through the measurement of the time of flight divided by the speed of light, known as the Time-Domain Reflectometry (TDR). Radars can operate on various frequencies from 1 GHz to 30 GHz. The higher the frequency the more accurate and costlier the device. Radars can measure to 35 meters, (almost three times the range of the ultrasonic sensor) and has accuracy around 0.03% full scale, compared to 0.25% of the target distance found with ultrasonic sensors. The water level radar is a non- contact solution and must be mounted over the water. This can be accomplished either by a bridge mount or a bank system. Similar to the ultrasonic sensor, typical applications include small streams and canals.
The upper left image is a bank mounted water level radar installation in Bhutan. The upper right image is a bank mounted water level radar installation in Poland which required a longer boom length to reach out past the bank, and over the water.
Cost: $3,000 USD on up.
Specifications: Technology: Radar, Target Distance Maximum Range: up to 70 m, depending on the application, Accuracy: ± 3 mm, Transmitting Frequency: 20 – 30 GHz, Signal output: SDI-12 or as supported by the DCP, Warranty: 2 years.
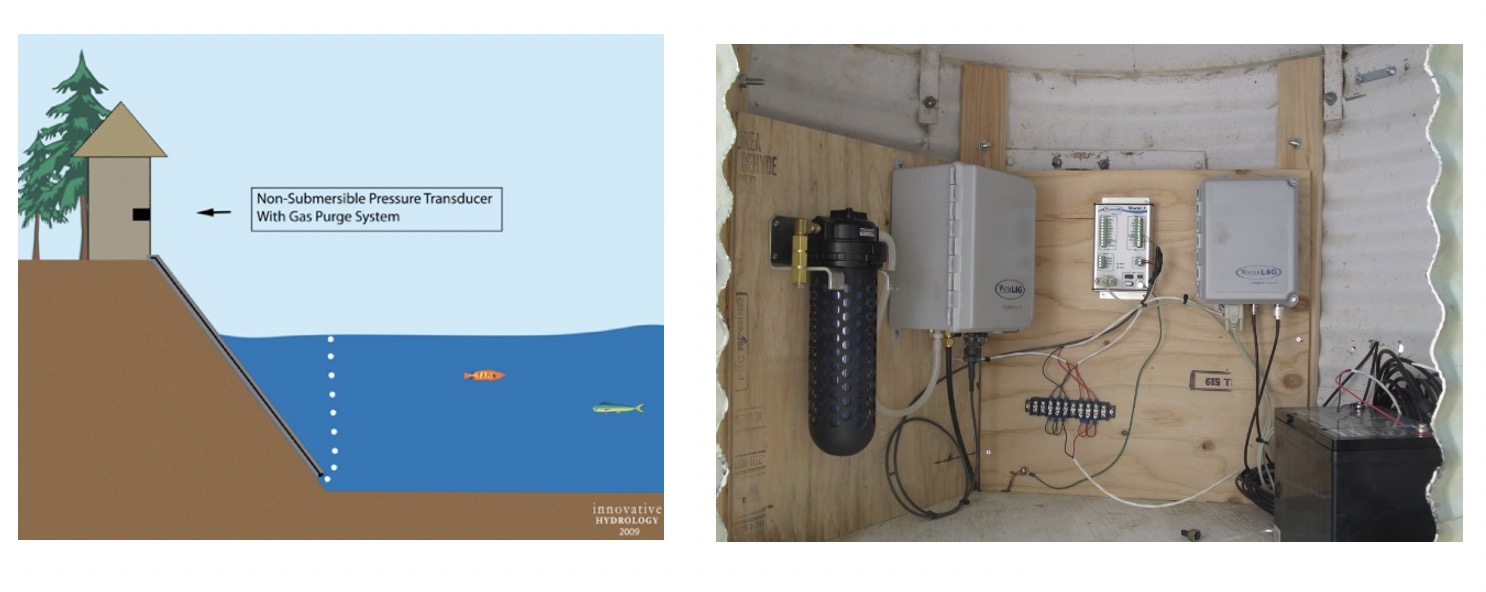
Description: The bubbler water level sensor is a common method of water level measurement. The system typically consists of a compressor, orifice line, pressure transducer, tank and desiccant. Also known as a gas-purge system, the bubbler allows a small quantity of air or inert gas (e.g., compressed air) released through a plastic line (orifice line), at the bottom of the water body. The pressure of the air that is forced out of the orifice line is measured and used to calculate the head of water over the orifice. There are two types of bubblers on the market: a continuous and non- continuous bubbler. A continuous bubbler keeps the orifice line under pressure by producing approximately 1 bubble per second. The non- continuous bubbler only turns on at a set time allowing water to feed back up the orifice line, requiring the sensor to purge and stabilize the line.
Bubblers can be specified to the range of maximum head of water, usually between 0 to 50 m. The bubbles are created by an onboard compressor, that takes ambient air and dries the air using desiccant, and stores compressed air in a small tank. The desiccant system needs to be maintained anywhere between a few months to annually, depending on how dry the ambient air is.
Ideal locations for the bubbler include open channels and reservoirs. In a river application, the location should have a stable channel over the course of the measured range of water levels.
Cost: $4,000 USD.
Specifications: Range: 15 psi or as required by the application; Accuracy : ± 0.02% Full Scale; Precision: < 0.02% per year drift; Resolution: 3mm @ 15 psi; Signal Output: SDI-12 or as compatible with the DCP; Air Drying System: System must not require maintenance for a minimum of one year of continuous service in the field; Sensor Type: Non-submersible transducer; Purge: Manual line purge. Bubble Rate: Programmable 30-120 bubbles per minute.
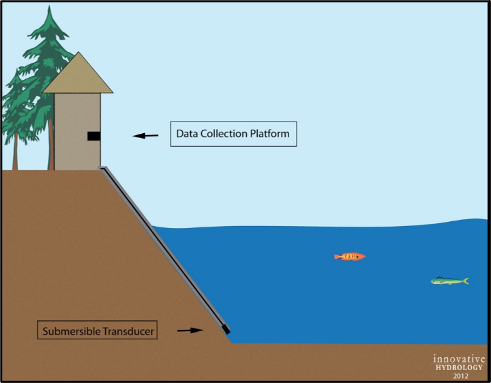
Description: A submersible pressure transducer is a contact water level sensor that measures the head of water above the sensor through the pressure exerted on the sensor head. Components are relatively simple and low cost, only requiring the sensor, cable and conduit to protect the sensor and cable. The sensors often include a vent tube which allows for compensation of atmospheric pressure. The submersible pressure transducer is most common in wells for measuring groundwater though it may be suitable in lakes and canals where debris or toxic water is not an issue. The sensor must be place below the minimum water level.
Operational range of the sensor may vary from 0 to 350m. It is important to select the full-scale range that closely meets your needs. Accuracy is typically based on a percentage of full-scale value, therefore the smaller the range the higher accuracy the measurement will be. It is important to not select a sensor range that is smaller than the maximum water level, this could cause damage to the sensor.
The submersible pressure transducers should be generally avoided in high velocity open streams, where water can carry debris and potentially damage the sensor.
Cost: $500 to $1,500 USD
Specifications: Range: 0-10m; Accuracy: ± 5 mm including reproducibility and hysteresis; Resolution: 1 mm; Precision/Stability: ± 1 mm/year; Output SDI-12, or as compatible with the DCP; Cabling: Must be provided and will be determined on site-by-site basis. High quality cable that will not compromise accuracy and stability.
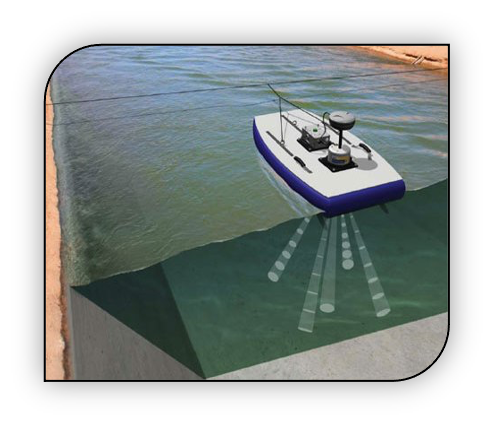
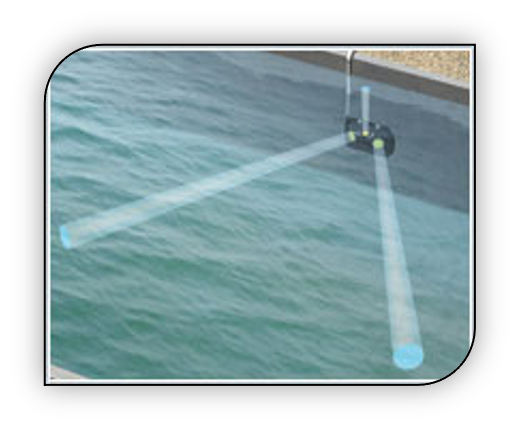
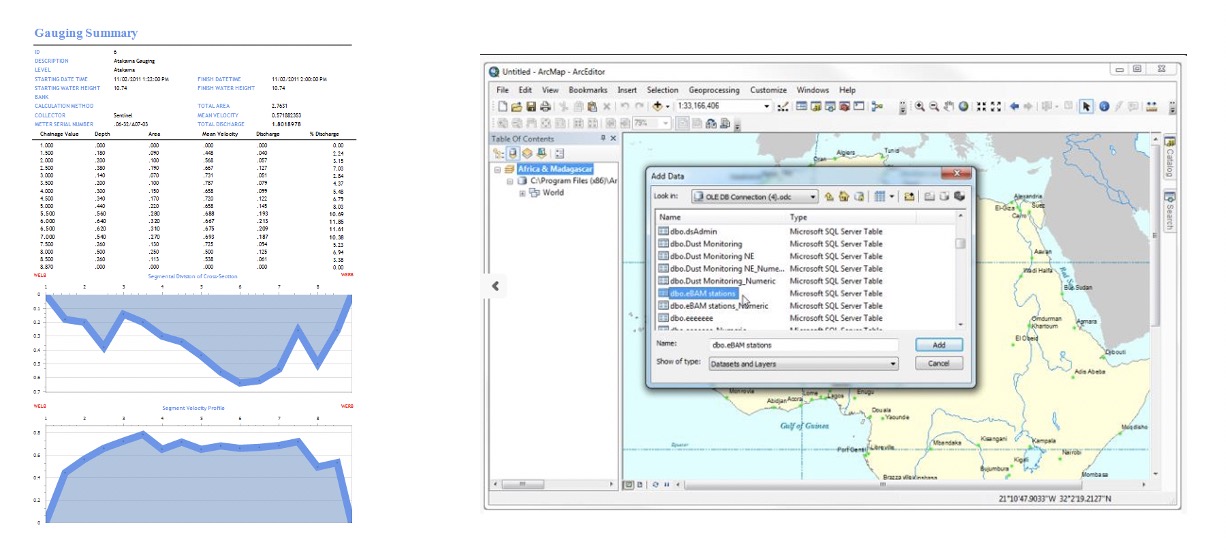
Description: The ADCP relies on SONAR which uses sound waves to determine the distance to targets. The Doppler Effect is used to resolve the speed of targets. The down looking ADCP is different than an up looking and side looking ADCP being that it is not an in-situ sensor and is used for channel profiling and measuring the velocity of a cross section in constructing a rating table (water level – discharge relationship).
The down looking ADCP is mounted to a small floating device or boat and pulled across the cross section of the gauging location. The ADCP captures the water velocity profile which in turn is used to calculate discharge/flow. A vertical/down looking ADCP is recommended for Bhutan. Accessories should include a platform, tag lines, and other equipment necessary to perform measurements from shoreline and bridges.
The down looking ADCP comes with a handheld control unit that is used to collect velocities in real-time, provide warnings, and eventually assemble and calculate total discharge.
Cost: $25,000 USD plus accessories.
Specifications: Profiling Distance: 0.3-10m; Profiling Velocity: +/-20m/s; Velocity Accuracy: 0.25% of measured velocity; Velocity Resolution: 0.001m/s; Depth Range: 0.3-10m of depth; Depth Accuracy: ± 3 mm; Depth Resolution: 0.001m; Discharge Distance: 0.3-10m; Signal Output: SDI-12 (or as compatible with DCP; Computations: All performed internally; Accessories: Floating platform, GPS for bottom tracking, All necessary tethers and taglines, Real-time display for instantaneous readings
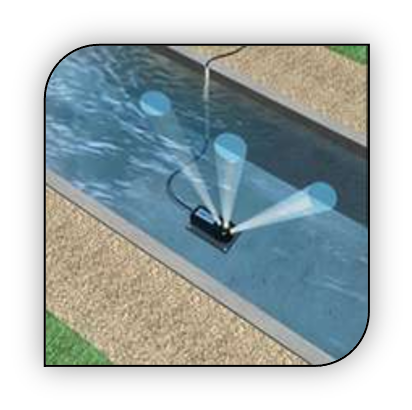
Description: The up looking ADCP is mounted to the bottom of a stream or canal and provides instantaneous discharge measurements. Debris should be minimal, as the device can be damaged if it encounters rocks and/or trees being carried by the current.
The up looking ADCP is often used in hydropower projects in raceways leading up to penstocks. As with the other ADCP’s, the device is very expensive, and the user should be very selective on its use.
Cost: $12,000 USD
Specifications: Water Level Range: 0.2-5m; Water Level Accuracy: +0.1% of measured level, +0.3 cm. Velocity Range: + 5m/s; Velocity Accuracy: +1% of measured velocity, +0.5 cm/s; Velocity Profiling Depth: .03-5m; Signal Output: SDI-12 or as compatible with the DCP inputs logger inputs.
Description: The side looking ADCP is an in-situ bank-mounted sensor that is most commonly mounted in canals or estuaries where the water level is not expected to change considerably under low water velocity conditions. It is not advisable to use these devices in streams that have considerable slope that can carry debris, such as trees. The theory of operation is similar to the up looking and down looking ADCP applications, except that the beam runs laterally from the bank, measuring velocity along the beam.
The optimum application of the side looking ADCP is in backwater conditions, where water is moving at relatively low velocities with little or no change of water level with velocity. All ADCP's are expensive and should be used only when and where warranted.
Cost: $15,000 USD
Specifications: Depth Range: 0.3-10m of depth; Depth Accuracy: The greater of +/-0.6 cm or 0.1% of measured depth; Sampling Range: 1.5-100m or as determined upon inspection site; Vertical Beam Range: 0.2-15m; Horizontal Beam Width: 1.4 degrees; Vertical Beam Width: 3.8 degrees
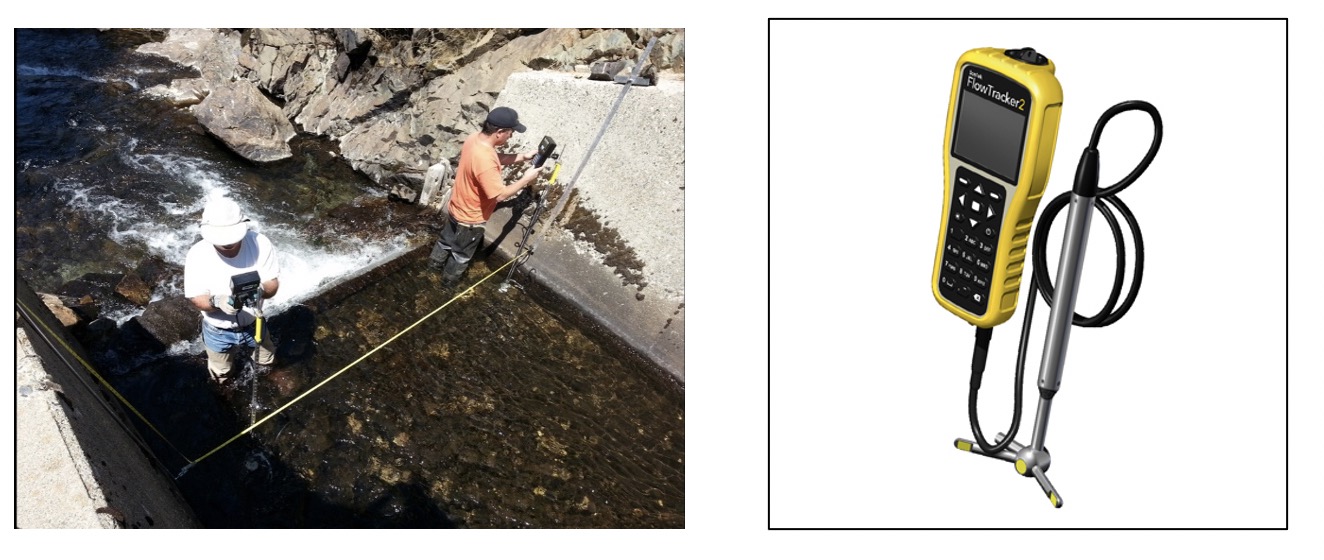
Description: The Acoustic Velocity Meter (AVM) is a hand-held instrument used for stream gauging. The AVM is generally used in shallow water, down to 0.2m and a velocity range of 0.001 to 4.5 m/s. The AVM is attached to a wading rod, where it is lowered and raised to different water level elevations to measure velocity within that column. This is done in increments at a cross section of the channel to produce a discharge calculation. The Acoustic Velocity Meter is accompanied with a handheld device that displays and/or logs the individual measurements. These measurements are then used in the calculation of discharge.
Cost: $8,000 - $12,000 depending on the accessories.
Specifications: Maximum velocity: 4.0 ms-1, Velocity accuracy: ± 1 % of measured velocity, Velocity resolution: 0.0001 ms-1, Minimum depth of water: 0.2 m, Communication: RS-232, Handheld communications system using AA batteries for at least 10 hours of continuous use. LCD display for easy visibility in bright light conditions.
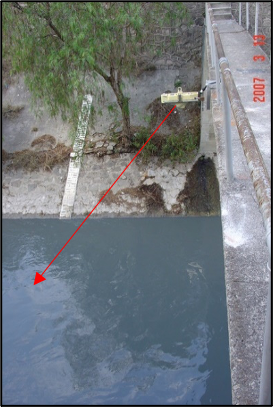
Description:Radar discharge measurement device is a non-contact solution to measure flow, which is most commonly mounted to a bridge as depicted in the picture above. The device generally uses two sensors and assumptions to calculate discharge. One radar measures the elevation of the water level while the other measures the velocity of water at the surface. The channel profile must be programmed into the device’s algorithm so that the discharge approximation can be calculated. As the velocity of water is measured at the surface, an assumption is made of the velocity over the cross section. Assumption is made on the velocity profile, both horizontal and vertical.
The radar discharge is best suited in symmetric channels, such as canals. When used on larger streams or rivers the operator of the device must understand the assumptions of the device makes to determine if the sensor will provide usable measurements. Since the device measures surface water velocity and assumes for the rest of the channel, larger rivers where the radar measurement does not represent flow of the entire channel or where there are multiple channels within the cross section, multiple sensors may be needed.
Cost: $10,000 - $15,000
Specifications: Velocity measurement technology: Radar, Velocity range: 0.25 – 6 ms-1, Accuracy: ± 0.03 ms-1, Depth measurement technology: Radar or ultrasonic, Depth range to target: .5 – 6 m, Depth Accuracy: ± 0.25 cm, Signal output: Compatible with DCP.
Ground Water
Description: A submersible pressure transducer is the most common sensor used for measuring groundwater level. The sensor measures the head of water above the sensor. Components are relatively simple and low cost, only requiring the sensor, cable and conduit to protect the sensor and cable. There are two types of pressure transducers (vented and absolute). Vented sensors include a vented tube which compensates for the atmospheric pressure, while absolute pressure sensors measure the hydrostatic pressure only and rely on an additional outside pressure sensor integrated into the system. Vented systems will require technicians to change desiccant at regular intervals. Absolute systems will require an atmospheric pressure measurement/sensor to compensate of ambient atmospheric pressure.
Wells may have a nest of submersible pressure transducers that cover various depths of the water table. Operational range of the sensor may vary from 0 to 350 m. It is important to select the full-scale range that closely meets your needs. Accuracy is typically based on a percentage of full-scale value, therefore the smaller the range the higher accuracy the measurement will be. It is important to not select a sensor range that is smaller than the maximum water level, this could cause damage to the sensor.
Groundwater sensors come equipped with data loggers. The devices are generally low power, and in some applications can operate for over one year on a small battery assuming daily measurements and weekly transmission.
Cost: $3,500 (starting, increasing with increasing cable lengths).
Specifications: System will be a complete in-pipe solution with all components inserted within a pipe. Water Level Range: 0-3m, Accuracy: ± 2 mm, Resolution: 1 mm, Precision/Stability: ± 1 mm/year, Signal Output: SDI-12, 4-20mA, or voltage to be compatible with DCP, Cabling: vented (length will be determined based on-site survey or at the time of installation)
Water Quality
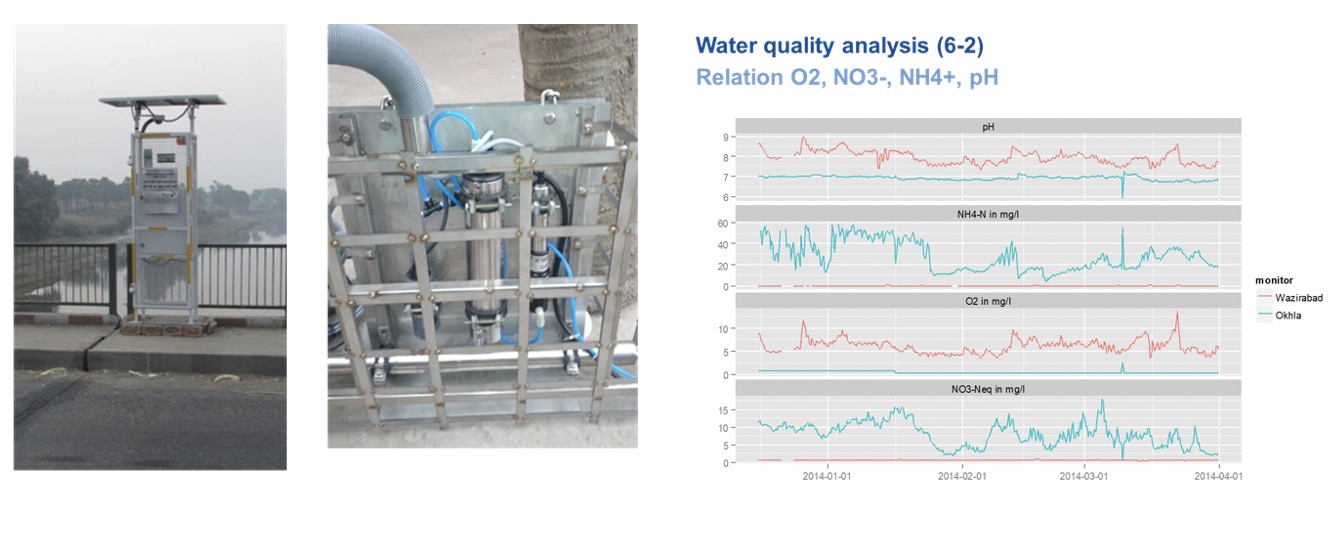
Description: Online water quality sampling is rapidly replacing manual collection and analysis of water samples. The unattended online water quality measurement allows for data to be collected 24/7, which allows the agency to see variations throughout the day, and especially sudden exceptional changes in water quality. Collecting data in real-time allows accelerates the analysis and decision making. Another objective of continuous online monitoring is establishing representative baseline chemistry of the water body (i.e., river, lake, etc.).
There is a wide variety of sensors/parameters available for online (real-time) monitoring. Parameters include 1) Ammonia, 2) Chloride, 3) pH, 4) Nitrites, 5) Conductivity/Salinity, 6) Dissolved Oxygen, 7) Turbidity, 8) Blue Green Algae, among dozens more parameters. The sensors are sold as individual sensors, but also can be combined with other sensors as part of a sonde.
Sensor technology also widely varies. Some sensors use an electrode, and other sensors employ a spectrometer to measure exotic pollutants such as BOD, COD, and BTX.
Cost: Variable. $2,000 - $50,000 USD depending on the suite of instruments.
Specifications: Because of the large number of water quality sensors, it is not possible to suggest the specifications for all sensors.
Weather Radar
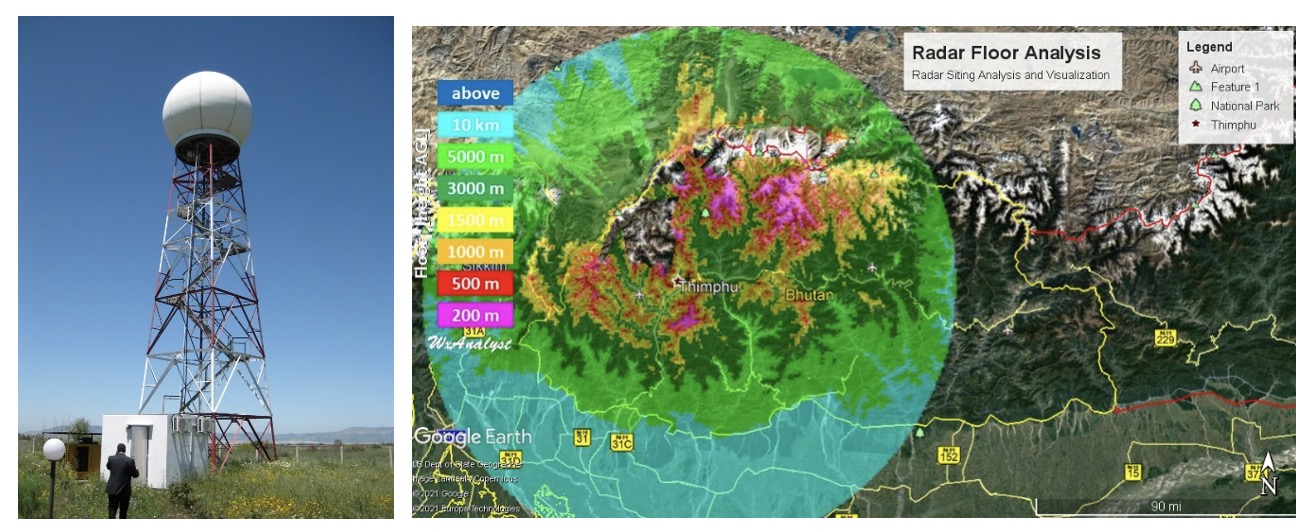
Description: A weather Radar detects and quantifies rain and snow. A Doppler weather Radar, see image above and to the left, also detects wind speed and direction in addition to precipitation. This measurement is not only important to Water Resources Management (WRM), but also Disaster Risk Management (DRM).
The picture above-right shows a Radar site analysis. The colors indicate the lowest Radar beam altitude above the ground. This analysis indicates that a single weather Radar can detect and quantify precipitation for over half of Bhutan, providing NCHM with areal estimates of the intensity and quantity of precipitation.
A weather Radar is a single asset that can characterize weather over a large area. Weather Radars are available in several wavelengths, with S-Band and C-Band being the most popular for NHMSs. The S-Band Radar is less prone to signal attenuation but is also less sensitive. The S-Band Radar is commonly used for coastal applications, especially in cyclone/typhoon/hurricane prone areas. The C-Band radar more easily attenuates in heavy precipitation but is more sensitive to lighter precipitation. The C-Band radar is commonly used for mountain meteorology. The X-Band Radar is even more prone to signal attenuation but can detect very light precipitation. The X-Band Radar is often applied in atmospheric research projects. The best solution for Bhutan would be to employ a C-Band Radar which will provide continuous rainfall coverage over 70,000 km2, centered on Thimphu
Cost: $1.5 million USD for radar and pedestal. ~ $2.5 million including all civil works, such as access, power and communications.
Specifications: Weather Radars require specifications that are beyond the scope of this documentation. It is advised that an NHMS procuring a Radar get specifications prepared under a small subcontract.
Data Collection
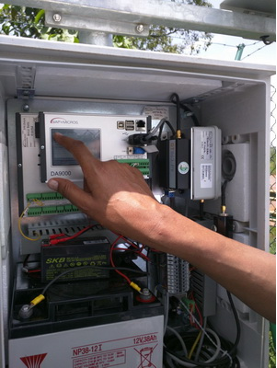
Description: A commercial Data Collection Platform (DCP) provides the control for environmental monitoring stations perform measurements from electronic sensors, store data, and control telemetry systems. For clarification purposes, a DCP and Data Logger refer to the same equipment in this discussion. DCPs nominally trigger measurements, collect data and store records for any desired data that is measured by the sensors. A high-quality DCP will be able to record both digital signals, analog signals and battery status. Common digital signal types include SDI-12, RS-232, RS-485. Analog signals should include current, voltage, count, and frequencies. The quantity and types of data input vary by DCP manufacturer.
It is important when selecting a DCP that potential expansion of station and network be considered. Selecting a DCP that has the flexibility to expand the number of sensors and telemetry types will save your agency the cost of possible DCP replacement if the agency wishes to expand the sensors on a given DCP. Some DCPs come with a setup/status screen (like the DCP in the picture above) to give the user the ability to view DCP logger status, sensor status, while providing the ability for the user to change configuration. DCPs that do not offer a status screen allow the user to use a smartphone or other smart device to program and display data collected by the DCP. High quality DCPs can transmit data over multiple radios simultaneously.
For instance, a high quality DCP can transmit data over the mobile network and over satellite simultaneously, while also collecting data from the attached sensors.
Cost: $400 to $4,000 USD.
Specifications: User will need to examine requirements prior to building specifications. For instance, the number of sensors to be connected and the possible requirement for multi-path simultaneous telemetry.
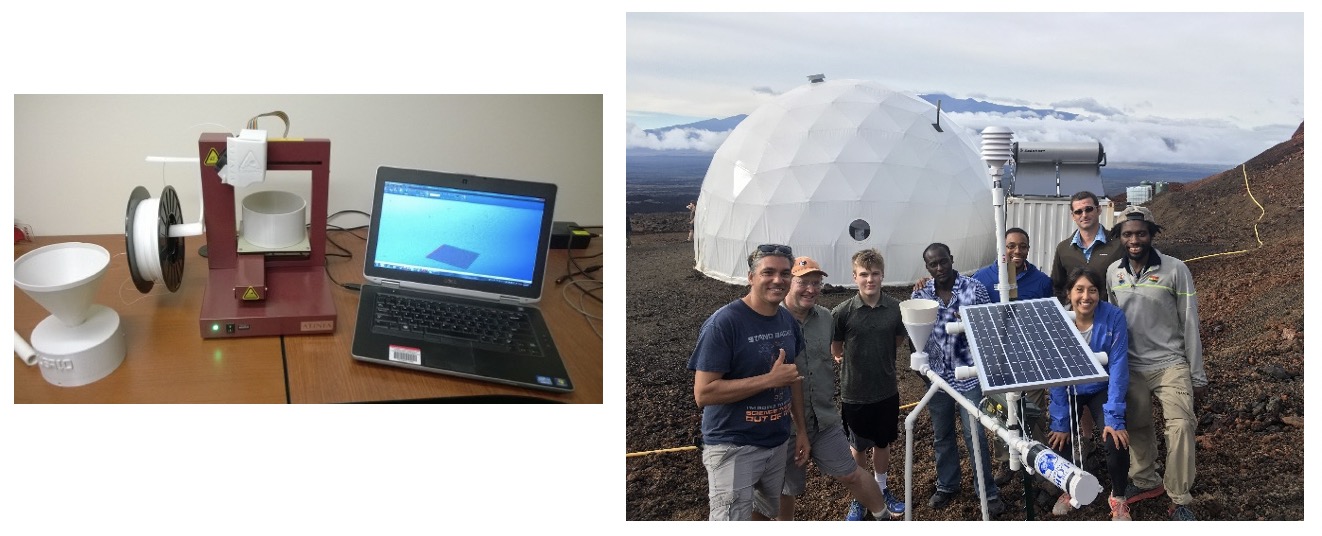
Description: 3D PAWS stands for 3-dimensional Printed Automatic Weather Stations. The 3D PAWS is a high-quality automatic surface observation station that can be manufactured in about a week, at a cost of only $200-400 USD, using locally sourced materials, microsensor technology, low-cost single board computers, and a 3D printer. The 3D printed automatic weather station sensors measure pressure, temperature, relative humidity, wind speed, wind direction, precipitation, and water level. The system employs low-cost Arduino technology for data acquisition, data processing, and communications.
The 3D printed station technology can be applied to just produce precipitation stations, or just water level stations, or any combination of measurements that are supported by the technology. For instance, a user may just want to add rainfall stations in order to support decisions regarding landslide or extreme precipitation detection. Alternatively, a low-cost water level station could be quickly adapted to monitoring irrigation canals.
The main take-away is the 3D PAWS lets the operator (NHMS) build the type of station needed, in the numbers needed for a small fraction of the cost it takes to purchase commercial equipment.
Available sensors include 1) atmospheric pressure, 2) temperature, 3) relative humidity, 4) wind speed, 5) wind direction, 6) precipitation (rainfall), 7) light, and 8) water level (ultrasonic)
Cost: $3,000 USD for 3D Printer. Supplies and parts to fabricate monitoring stations cost start at $100 USD per station.
Specifications: The 3D-PAWS can be acquired through agreement with the National Center for Atmospheric Research. For more information, please contact: Paul A. Kucera, Ph.D., UCAR/COMET, P.O. Box 3000, Boulder, CO 80307 USA, +1 303 497 2807 pkucera@ucar.edu. The Comet Program, http://www.comet.ucar.edu/
Data Transmission
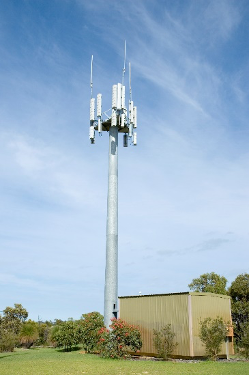
Description: The mobile network is likely the most widely used data transmission system used in hydromet data collection. Mobile network communication is supported by every major DCP manufacturer. Additionally, the mobile network has large coverage footprint. The communication is two-way, which allows the hydromet system operator to perform “ad-hoc” activities, such as downloading data or reprogramming the DCP.
Despite the wide use of the mobile network transmission system, it comes with some significant drawbacks. For instance, unlike the GOS satellite DCS mission, which is reserved for the environmental monitoring, the mobile network is a public network. This means that the hydromet observations being measured and transmitted to the national hydromet center are directly competing for bandwidth the public. In times of national emergency, the mobile network can overwhelm the mobile network system, thus slowing the transfer of information from the field to the national center. In the case of monitoring in a watershed, there may be no mobile network coverage, thus the user must use satellite for data relay.
It must also be pointed out that the mobile network is a “best effort” application, whereby the network operator has no certain obligation to restore communication, in the case of a tower/network outage. Finally, the mobile network use comes at a cost, payable to the mobile network operator. In many international cases, the cost for mobile network communication is manageable.
Cost: $500 - $1,000 USD per radio/modems.
Specifications: The mobile network radio/modems must be compatible with the mobile network and the DCP. The mobile network radio/modem to allow for text messaging and internet connectivity.
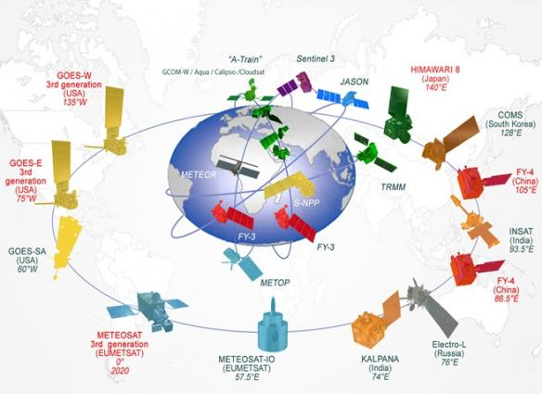
Description: Description: The Global Observation System (GOS) describes a set of geostationary and polar orbiting meteorological satellites that are operated in international meteorological agencies. The satellites perform a wide range of services and observations, including “high reliability” Data Collection Service (DCS). DCS is a service that is used to relay observations from stations through a given satellite and eventually back to the NHMS via GTS or other means. The service is generally free to use after an application is approved by the satellite operating agency. This data relay service was specifically targeted for use by an NHMS and their cooperators and is widely used throughout the world. The non-recurring data transmission/relay expenses make this an ideal solution for NHMS’s that are looking for a solution that is financially sustainable. The transmissions are one-way and are pre-programmed in the DCP to transmit at regular time intervals, or when an exceptional event occurs (i.e., sudden rise in water level, water level thresholds, or exceptional rainfall).
The process of relaying the information can take as little as a few seconds to reach the NHMS after the transmission from the surface observation system (i.e., AWS, AWLS, etc.) making this solution highly suited to suddenly occurring weather related hazards. NCHM currently uses GOS in transmitting data from GLOF stations. In the case of GLOF stations, data is transmitted through METEOSAT and relayed back to NCHM. Other potential partners could be Himawari-DCS, operated by the Japan Meteorological Agency (JMA), or FY4A-DCS operated by the China Meteorological Administration.
Cost: Radios used to transmit to these satellites range from $1,000 USD to $2,500 USD. In some cases, the radios are integrated into DCPs, with a total cost as low as $2,000 USD.
Specifications: Specifications should clearly indicate that the radio must be approved and certified for use by the agency the satellite-DCS operator. The radio must be a current model and supported for the next 10 years.
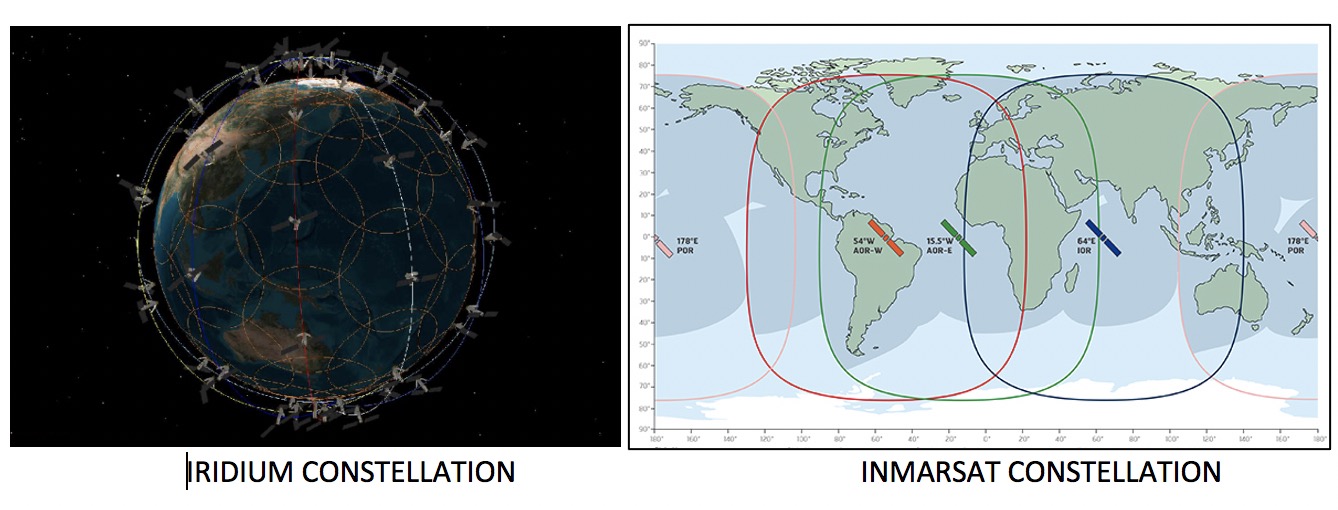
Description: IRIDIUM-SBD and INMARSAT-BGAN are two meteorological data relay services. These satellites provide either one-way or two-way communication. The IRIDIUM constellation uses a 66 polar orbiting satellite, providing full earth coverage while the INMARSAT constellation uses four geostationary satellites, with reduced coverage over the poles. The cost of radio operation can be found in the range of $20-$30 USD per month per station, which can strain operational budgets of a NHMS, such as NCHM. With the ability of two-way communication, either service can be used to actuate sirens or other alarm mechanisms, which is not possible with GOS DCS systems. IRIDIUM and NCHM currently utilizes this technology in the GLOF warning system, to turn on sirens in advance of a GLOF event.
Cost: $1,000 USD or higher per radio, depending on connectivity package.
Specifications: The radios must be approved for use by IRIDIUM/INMARSAT depending on which service and connectivity package required.
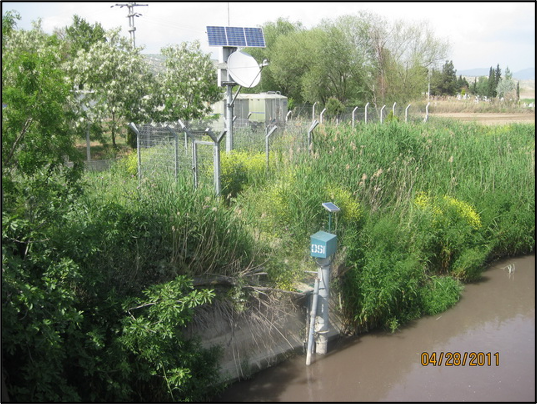
Description: A Very Small Aperture Terminal (VSAT) is a two-way satellite secure IP ground transmitting station with a dish antenna generally in the range of 75 cm to 1.2 m. Data rates, in most cases, range from 4 kbit/s up to 16 Mbit/s, which is more than what is required to relay reading from a hydromet station. VSATs access satellites in geosynchronous orbit or geostationary orbit to relay data from small remote Earth stations to other terminals or master Earth station "hubs". Without a local hub, the data can be relayed from a local hub to a NHMS, such as NCHM, over the internet. Of course, the reliability of data reception without a local hub relies on the internet reliability.
The cost of the service can be exceptionally high but is expected to come down as the availability of internet over satellite becomes more common place. Rates can be charged by total bandwidth, such that a 40 kB service can utilize the full 40 kB continuously, though VSAT operators may choose to charge for bandwidth and data, which can make the technology unaffordable for typical NHMS use but may be more practical for hydropower that is providing a service that derives direct income and can afford the solution. India uses VSAT in the larger irrigation schemes in order to relay measurement and control gates and valves along the irrigation canal.
The picture above shows a water level measurement station using VSAT in Turkey. Turkey found data relay from these types of stations very expensive sustain, which led to deactivation of VSAT relay system.
Cost: Less than $1,000 USD per transmitter.
Specifications: The specifications for the VSAT radio/antenna should be provided by the VSAT operator.
Database & Quality Management Software
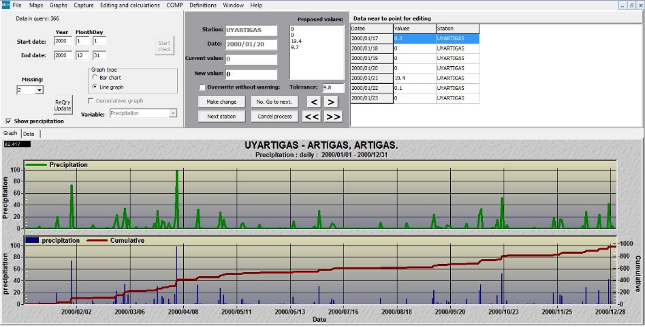
Description: : MCH is an open-source database management system developed by the National Meteorological and Hydrological Service (NMHS) of Mexico. MCH can be used on a single computer (standalone configuration) or in a network configuration. It can connect to automatic stations and gather real time data. MCH offers NMHSs a simple tool to manage data without their having to purchase licenses. It can be used to gathers data from measuring stations and to digitize in a standardized format years of backlog observational data records on paper and/or in other centralized data sources (MS Excel or Access, for example). As of 2018, some 24 WMO Members have expressed an interest and been provided with the MCH software and appropriate training, and more and more Members are using it operationally.
MCH is available on request through the Permanent Representative of your country with WMO.
More information: https://community.wmo.int/mch-meteorology-climatology-and-hydrology-database-management-system.
Cost: $0 USD. Freely available from the WMO.
Specifications: Not applicable. Can be requested through the WMO.
Description: Field maintenance tracking software is software that allows technicians to track maintenance activities and equipment inventory related to the operation and maintenance of a hydromet observation network. This type of software is intended to optimize field maintenance by tracking field visits, what was performed during the field visit, and the equipment being maintained by the technical staff. The concept of this software is to add accountability and allow staff a method of recording visits.
Another purpose of the software is to track equipment, whether it be installed at sites, in storage, or out for maintenance. The software allows the technical staff to characterize the operational readiness of all equipment, and the general status of the network at any time. Software like this can be acquired at minimal cost, and preferably purchased outright, avoiding the ongoing licensing and maintenance costs often associated with software.
Examples of the information that can be provided by field maintenance tracking software include:
1. Ability to track the maintenance that has been performed at a given station.
2. Ability to track the maintenance activities of the technical staff.
3. Ability to track systemic problems, easily sortable by make/model, age of equipment, or the sensor type.
Cost: $2,000 USD.
Specifications: Software used to track maintenance visits and equipment condition and location.
Description: Aquarius, DataSight and Hydstra are all commercial off. The software solutions are powerful applications used to collect, correct, store, and produce “data for record”. “Data for record” is considered the cleanest data that has gone through the quality control process. In the case of hydrological records, the software can also apply stage shifts and produce rating tables based on current meter measurements and simultaneous water level readings. The time-series data management applications are generally costly, with most packages requiring an annual maintenance fee in order to keep the software active.
Cost: $15,000 - $25,000 USD.
Specifications: Dependent on modules that are required.
Surface Water Measurement
For More information Visit: Primer on Measurement Systems below:
Data Rescue
Despite the rapid change in technology, many water agencies around the world still have many records in paper form or on many distributed databases such as spreadsheets on individual desktops. These could include information on well logs, fence diagrams, borehole records, streamflow records, water use, climate, metadata, computations, maps, etc. Wherever possible, there is a need to undertake “data rescue” – with the immediate assessment, categorization and digitization of relevant information, integration of these information into digital data in appropriate formats and ideally integrated into online services and a new online system to collect such information in the future.
Surveys
Household surveys, farm surveys, water quality surveys, on-ground elevation…
Surveys
Bathymetry surveys allows us to map different underwater features of a water body. Multiple ways can be used to conduct bathymetry surveys including multi-beam surveying, single-beam surveying, ADCP (Acoustic Doppler Current Profiler), through use of autonomous underwater vehicles, or airborne drones. Some of the examples are discussed below.
CEE HydroSystems is using drone boats to survey mine water reservoirs, helping them determine the volume of water and several pH3 heap leach reservoirs.
EcoMapper AUV (autonomous underwater vehicle) collects high-resolution maps of water quality and bathymetry. Key applications of the AUV include baseline monitoring, source water mapping, event response, bottom mapping and point-source as well as non-point source mapping.
UGCS airborne bathymetry survey uses a UAV drone equipped with echo sounder to provide acquire bathymetry data of coastal and inland water, enabling data collection even in hard-to-reach areas.
Aquagenx CBT EC+TC is a rapid onsite water quality testing kit by changing color that can check for the presence or Most Probable Number (MPN) for E. coli and Total Coliforms without the use of lab equipment.
The Idexx Quanti-Tray 2000 is a rapid, easy-to-use method to quantify coliform E. coli and enterococci using the most probable number (MPN) in water or wastewater. Sample water is mixed with reagent and then poured into the tray. The tray is sealed and incubated for 24 hours, where yellow and positive fluorescent wells of each size are counted and compared to statistical charts. Statistical charts convert the total number of positive samples and wells into an MPN value.
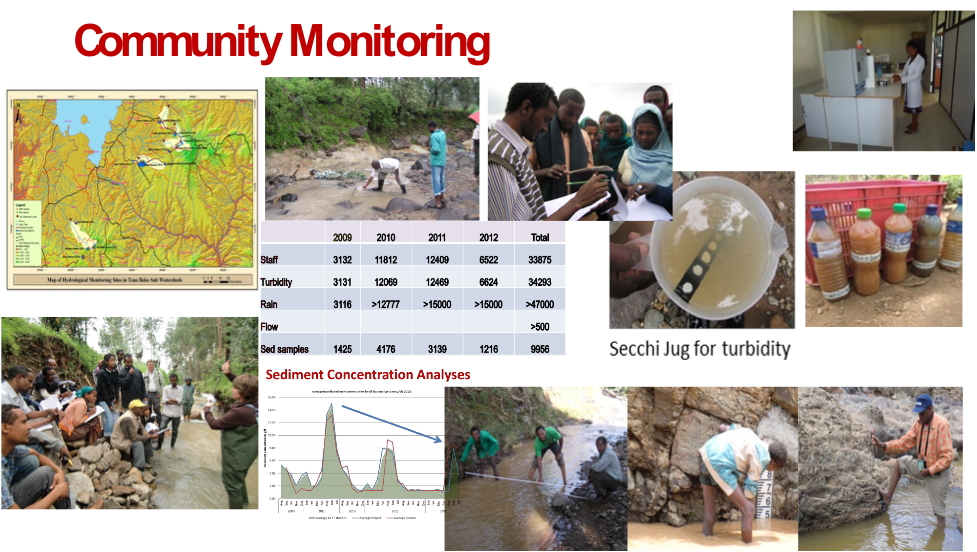
Crowdsourcing
There are a range of more digital methods that are starting to replace traditional log registers leveraging increasingly ubiquitous smartphone access (or SMS-based systems for legacy access). This facilitates better data entry and also provides a platform for structured and unstructured crowdsourcing of data from targeted users and community monitoring and citizen report cards . These will become more prevalent as connectivity and mobile data access improves and in a few years, 5G could also revolutionize edge computing and access speeds further.
The LOCSS (Lake Observation Citizen Science and Satellite) project aims to better understand lake dynamics by combining the efforts of citizen scientists with satellites. At 70 places worldwide, citizen scientists report lake height by reading lake gauge heights and then sending the data via text message or email. These results are combined with lake surface area data generated from satellite pictures. Researchers can figure out how the volume of water in a particular lake fluctuates over time. It can aid in understanding how water travels in connection to these lakes and their surrounding terrain.
Managing Aquifer Recharge at the Village level
MyWell is a smartphone and SMS app for collecting and analyzing data related to depths to well water level, rainfall amounts, checkdam water levels and water quality parameters. The crowd sourcing app engages farmers, schools and local communities, displays the current status of the groundwater level in addition to the above parameters, with historical values for comparison and analysis.
TamilNadu water quality kit was developed to promote community participation and creating awareness in schools. The kit uses reagents to test for 12 water quality parameters, which include ph, hardness nitrate, phosphate, chloride, bacteriological examination, etc.
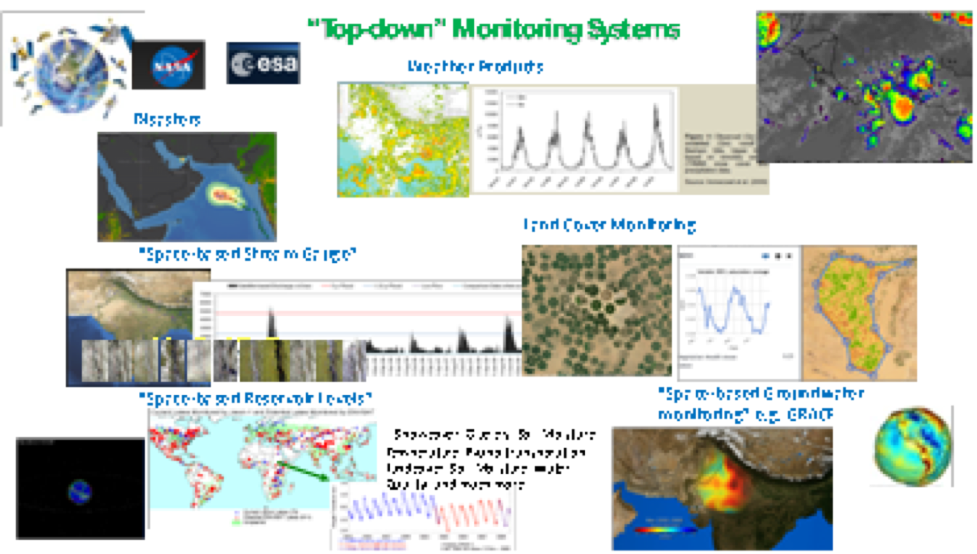
Top-Down Mechanisms
A whole new generation of new “eyes in the sky” has resulted in a range of new free (e.g. from NASA , ESA ) and subscription global services for earth observation that are not just using the visible spectrum but other wavelengths that can be used to see through clouds, determine vegetation health, estimate rainfall, evapotranspiration, and many other parameters that can be useful for water management.
Satellite Earth Observation
See an overview of how Earth Observation can be used in Water Resources Management. See an interactive e-book (Developed by NASA and the World Bank) summarizing some of the common water-related earth observation data services and additional discussion of options from the European Space Agency .
Climate Hazards Group InfraRed Precipitation with Station data (CHIRPS) is a quasi-global daily or pentad rainfall with 40-years of record starting from 1981- to the near present. CHIRPS blends satellite rainfall imagery with station data. A monthly video from 1981-2016 of Africa is shown in the nearby video.
NASA's Integrated Multi-Satellite Retrievals for Surface Precipitation, (IMERG) , provides most of the world's surface precipitation data. IMERG incorporates historical Tropical Rainfall Measurement Mission estimates from 2000 along with Global Precipitation Measurement. Multiple satellites allow for the development of half-hourly rainfall estimates at a 0.1° horizontal resolution.
Sentinel-1 is the first satellite in the European Space Agency's and European Commission's Copernicus satellite constellation. The mission is made up of two satellites, Sentinel-1A and Sentinel-1B, that orbit in the same orbital plane. Sentinel-1 is equipped with a C-band Synthetic Imaging Radar (SAR) capable of imaging down to 5 meters and covering an area of up to 400 kilometers. SAR satellites are not affected by cloud cover or lack of illumination and can collect data over a day or night, under all weather conditions. It is planned to acquire high-resolution images of all global landmasses, coastal areas, and shipping channels, as well as vignettes of the global ocean.
The European Space Agency operates Sentinel-2 as part of the ESA Copernicus constellation. Twin optical high-resolution multispectral satellites flying in the same orbit but phased 180° apart are planned to have a 5-day revisit frequency at the Equator. Sentinel-2 carries an optical instrument payload that samples 13 bands where the spatial resolution ranges from 10 meters to 60 meters. Sentinel-2’s provide continuity of SPOT and Landsat-type image data by contributing to ongoing multispectral observations and are used for various purposes, including land management, agriculture and forestry, disaster monitoring, humanitarian relief operations, risk mapping, and security concerns.
Landsat 8 , launched in 2013, is the eighth satellite designed to continue the program of global space imagery acquisition that the United States has been implementing since 1972 with the help of the Landsat series. The multispectral satellite samples imagery in 11 bands: the visible, near-infrared, shortwave infrared, thermal and panchromatic band. The improved thermal band would improve the study of heat and moisture transfer in the agriculture and water management sector.
Subscription Services: There is an increasing trend for private sector firms to offer data from private sources (e.g. high-resolution satellite images) or analytics from proprietary algorithms on free data (e.g. using machine learning) as paid subscription services for users. This Data as a Service approach will become more and more popular to leverage cloud service and interoperability to allow users to mix a combination of free and such subscription services for their use in visualization or further analytics to obtain insights for decision support. These currently exist for a range of earth observation (e.g. Maxar,Airbus, Earth-i), climate, weather (e.g. Tomorrow, aWhere, Planet Watchers), and water related services and these will invariably grow rapidly in the future.
Remote sensing of water resources in Bhutan
As of today, many studies have explored the monitoring mechanism of glacial lakes, glacial lake outburst floods, and water balance studies in Bhutan using remote-sensing data (such as Sentinel-1 synthetic aperture radar data, multi-Spectral imageries from Landsat 7 (TM), RADAR (SRTM) data and IRS-1D, LISS-III geocoded Satellite data) and Geographical Information Systems (GIS). Tropical Rainfall Measuring Mission (TRMM) Multi-satellite Precipitation Analysis (TMPA) products have also been used to estimate the runoff characteristics of ungauged basins of the Wangchhu river. Global navigation satellite systems (GNSS) have been combined to the Gravity Recovery and Climate Experiment (GRACE) to investigate the land deformation due to excessive hydrological loads.
A bird’s eye view of the glacial lakes in Bhutan Himalayas. They are located east of the Himalayas that extend 2,400km from west to east, seen from the sky on the southern side. This bird's eye view was made from the image observed by the Advanced Land Observing Satellite "Daichi" in June 2007 by using the altitude data acquired by Daichi in December 2007 (partially complemented by other data).
(For more information: https://www.eorc.jaxa.jp/en/earthview/2008/tp080402.html )
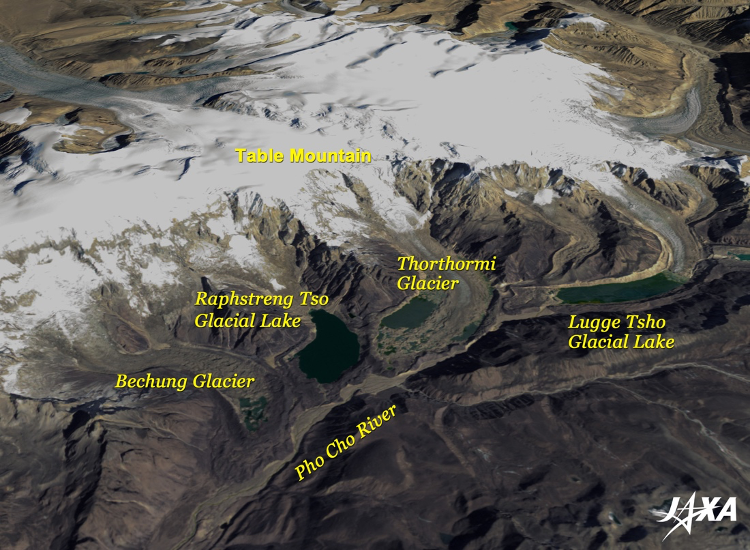
Glacial lakes in Bhutan
Global survey using scenes from NASA Landsat data has showed dramatic growth of glacial lakes such as the Lake Thorthormi in north-west Bhutan, one of the country’s most dangerous glacial lakes. See more information here: https://www.thethirdpole.net/en/climate/global-survey-using-nasa-data-shows-dramatic-growth-of-glacial-lakes/
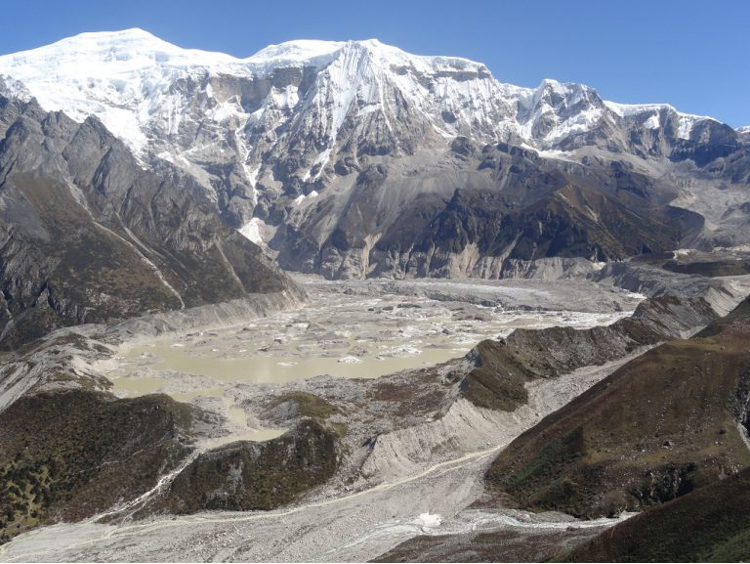
Lake Thorthormi, in north-west Bhutan, is one of the country's most dangerous glacial lakes [image courtesy: NCHM, Bhutan]
The United Nations Environmental Program says that Bhutan's glaciers are receding by 30 to 40 meters each year. The melting masses of ice are rapidly filling the mountain lakes. Bhutan has more than 2,600 lakes. 24 of them are considered dangerously overfull, especially the Thorthormi glacial lake in the far north of the country. Its capacity could soon be surpassed. If it overflows, the Pho Chhu Valley would be flooded. Bhutan is taking measures to prevent that.
Aerial Surveys
Over the last few years, researchers and development agencies have been using drones/planes to conduct aerial surveys and Heli-borne geophysical surveys of water resources that support vital ecosystems.
Virtual Planet is a company that explores climate impacts through visualization based on hyper realistic models. They have leveraged the capabilities of drones, 3D mapping and virtual reality technology to recreate different coastal and inland hazards and help communities to learn about potential challenges and to adapt to a new climate. They use drones to get photos and specific information about the area that they are going to study. Then they combine that information with local elevation data, flood information and sea level rise projections to make site-specific renderings for what each place should expect to see with rising seas.
Eyes in the Sky, Pollution in the Water
Earth observation from satellites and Drones/UAVs are a novel approach to monitor water quality from space for some parameter (e.g., chlorophyll indicating algal blooms, sediment, cyanobacteria, etc.). For example, GEO AquaWatch is an initiative of the Group on Earth Observations (GEO) to build global capacity and utility of earth observation derived water quality data, products, and information to support water resources management and decision making. Many of these approaches leverage the rapid growth in availability of satellite information in the public domain and analytical tools such as Google Earth Engine. There also appears to be significant potential to use machine learning and other AI approaches to help fill gaps and estimate other water quality parameters to support decisions. A major challenge remains access to even basic consistent data services on water quality across the world.