In recent years, the world has seen an explosion of innovation to help us rethink the data value chain (going from data->information->knowledge->decision support). These include new ways of collecting data from earth observation (increasingly powerful satellites and aerial surveys from planes, helicopters, balloons and drones), in-situ sensors (heading towards the much-anticipated internet of things or IoT) and surveys (e.g. using sonar, radar, high-resolution photos/videos, from manned and unmanned vehicles on and below the water, as well as crowdsourcing apps).
These data can be transmitted to more central data repositories through advances in telemetry (using Bluetooth, legacy mobile and newer 4G/5G, radio, satellite, and other mechanisms), where they can be better stored and processed especially using modern cloud services linked with geospatial data management, machine learning/AI, and other modeling approaches and made accessible as online services to create user interfaces through modern interactive dashboards, apps and decision support tools for a range of devices (e.g. smartphones, tablets, computers, VR/AR, operational control rooms, enterprise systems, etc.) to help provide better insights and planning and operational decision support.
Collecting Data
Earth Observation
Free and commercial satellites provide tools to observe and manage the resources in the ocean and the coast. Satellites, which are "eyes in the sky," have resulted in a range of new free (e.g., from NASA , ESA ) And subscription to global services for coastal and marine observations. Satellites use the visible part of the spectrum and other wavelengths that can see through clouds, identify oil spills, track ships, monitor coastlines, measure sea-level rise, and many other parameters useful for coastal and marine management.
Subscription Services: There is an increasing trend for private sector firms offering data from private sources (e.g., high-resolution satellite images) or analytics from proprietary algorithms on free data (e.g., using machine learning) as paid subscription services for users. This Data as a Service approach will become more popular to leverage cloud service and interoperability to allow users to mix a combination of free and such subscription services for their use in visualization or further analytics to obtain insights for decision support. These currently exist for a range of earth observation (e.g.Maxar,Airbus, Planet), ship tracking(e.g. ICEYE, Earth-I ), and blue economy services, and these will invariably grow rapidly in the future.
In-Situ Observations
As the earth covers 71 percent of the globe, there are significant challenges in monitoring the earth's ocean. The ocean's average depth is 3.7 km, where sunlight only an insignificant amount of sunlight penetrates 200 meters deep. Hence, most of the ocean s is unobservable using optical remote sensing, and data products are inferred from in-situ data. In-situ monitoring from surface drones, underwater vehicles, or buoys provides information on the water column on physical, biological, and chemical measurements at a higher resolution.
As smartphones have reached wide adoption, scientists are creating apps as a low-cost measure to use citizen scientists to collect data. Globally, the overall usage of smartphones has reached at least 80 percent for developing and developed countries . Smartphones are a high-tech cellphone that incorporates multiple sensors and an internet connection that can record data. Sensors include GPS, microphones, high-resolution cameras that can read QR codes or record video, accelerometers, and some phones now have included LIDAR. Apps use these sensors as a method to collect data since it reduces the cost of data collection and improves data efficiency. For example, a photograph uploaded into an internet database will include location and time.
Data Integration & Data Services
Scientists use research vessels, floats, self-driving vehicles, and satellites to collect data through the water column for oceanographic research. The data itself varies temporally from seconds to decades and spatially varies from micrometer to thousands of KM . The main challenge with combining different data types is overcoming the spatial and temporal resolution. Some initiatives (e.g. Bedrock ) chose to start from scratch and design a completely new approach to mapping oceans. Instead of autonomous surface vessels, their autonomous ships travel underwater. They then use high-frequency sonar to map ocean and seabeds with incredible accuracy.
As many stakeholders are more interested in the final product than the actual data, government and commercial organizations are developing data services (both free andd subscription-based) by generating value-added products from the raw data.
Data Analytics
There have been many advances in recent decades in Geographic Information Systems and Remote Sensing since the early days of GIS in the 1980s. You can find a quick overview of GIS and remote sensing at this link.
One of the most exciting areas of modernization in relation to data has been in terms of new ways to integrate and visualize the data on spatial platforms. Being able to visualize, manipulate and analyze spatial data is paramount to watershed management, given that many, if not all, aspects of basin management – climate, water resources, water use, landuse, etc. - depend on spatial relationships. There are a number of popular software that have been developed for undertaking GIS, remote sensing or other spatial analysis. Spatial tools for forestry management are included in commercial or open source Geographic Information System (GIS). Commercial GIS software has license restrictions, does not publish the underlying code and charges a licensing fee, but is often better streamlined. Open source GIS software publishes the underlying code, has less restriction on licensing and is free to use for commercial purposes, but is often less streamlined. An illustrative (but non-exhaustive) list of some popular open source and commercial software that can support forest management (e.g. spatial analysis, visualization, integration of GPS and other field data, etc.) include:
- Google Earth is a very popular way to get free 3-D high-resolution spatial perspectives on any watershed around the earth. It can now be accessed directly in a Chrome browser at http://earth.google.com or downloaded as a desktop version Google Earth Pro at the same site. It allows easy visualization of high-resolution satellite imagery timeseries draped over a 3-D model of the earth and also allows integration of GIS, animations, photos, videos, 3-D models, or other objects into the visual experience, along with fly-throughs of watersheds that can be shared as links or video files.
- Quantum (QGIS) GIS is a free open source program licensed under GNU Public license, QGIS is user friendly and provides a lot of documentation for beginners, it is also one if not the most widely used open source GIS software. QGIS is regularly updated and the code is maintained by a large group of developers. Furthermore, other programs on the list can be added to the QGIS toolset. QGIS can read most vector and raster file formats as well as all the common geodatabase and web map services. QGIS composer can produce maps from various layers.
- System for Automated Geoscientific Analyses (SAGA) GIS is a free open source program licensed under GNU Public license. SAGA GIS is a spatial modeling GIS program for intermediate to advanced users in spatial modeling. Users should note that SAGA GIS could be used as part of QGIS or R. SAGA GIS’s strength is in spatial statistics analysis, namely spatial sampling, interpolation and modeling. All SAGA tools can be used to predict forest fire as well as forest health risk indicators.
- Geographic Resources Analysis Support System (GRASS) GIS is a free open source program licensed under GNU Public license. GRASS GIS is for advanced users, preferably with experience in GIS and image processing. GRASS GIS is best used for raster analysis. GRASS computes various raster analyses such as Leaf Area Index (LAI), Normalized Difference Vegetation Index (NDVI) or forest fragmentation analysis.
- R + spatial packages (sp, rgrass7, raster, rgdal, spdep, rgeos) is a free open source program licensed under GNU Public license. R is a statistical scripting environment and includes many geo statistical analysis packages. R has a steep learning curve and is for advanced users with experience in GIS, spatial data analysis and python or another language. Albeit extremely versatile, R strength lies in script automation and statistical analysis. Shiny provides web-based support for R.
- IDRISI is a popular image processing software with a suite of associated tools primarily for raster data analysis.
- Environmental Systems Research Institute (ESRI) is an industry leader for commercial GIS systems (e.g. ArcGIS), used in over 350,000 organizations around the world. They also have free online GIS viewers. There are also a number of growing applications in forestry.
- Intergraph and Hexagon have a range of commercial geospatial software (e.g. ERDAS IMAGINE, GEOMEDIA) that are popular for remote sensing and GIS use.
- Harris has a number of products such as ENVI that are very popular for remote sensing analysis.
- Explore here to get more of a flavor for the large number of firms and open-sources and commercial spatial analytical products that could be useful in watershed management.
Looking ahead, there are a few new types of technologies that show immense promise for revolutionizing watershed analysis:
- Systems integration of existing software to create powerful new tools. For example, Collect Earth is a tool that combines the power for Google Earth, Bing Maps, and Google Earth Engine to facilitate data collection (E.g. to support multi-phase National Forest Inventories) – the data is also exportable to Saiku to facilitate data analysis.
- Machine Learning is a rapidly-evolving artificial intelligence discipline that helps systems to learn without being explicitly programmed – i.e., which can adapt the programs when exposed to new data.
- Virtual Reality or Augmented Reality may look like science-fiction now, but at the rate at which these technologies are being deployed, it will be relatively soon when one can visualize and interact with watershed development and climate scenarios in a completely different way than we currently do.
- Google Earth Engine is a radically new approach to spatial analysis, combining a growing catalog of free, public-domain satellite imagery and geospatial datasets with cloud computing and collaborative platforms. Some Google Earth Engine applications that are particularly interesting from a watershed perspective include:
- Spatial Agent
is an
innovative mobile App from the World Bank that seeks to showcase a growing set of
public-domain data from thousands of online mapping and data services. New versions include cloud
analytics
(e.g. computation of NDVI from MODIS or Landsat or CHIRPS rainfall data analysis) using the Google
Earth
Engine
API. This helps bring a world of information and analytics at one’s fingertips when exploring or
analyzing
watersheds around the world.
-
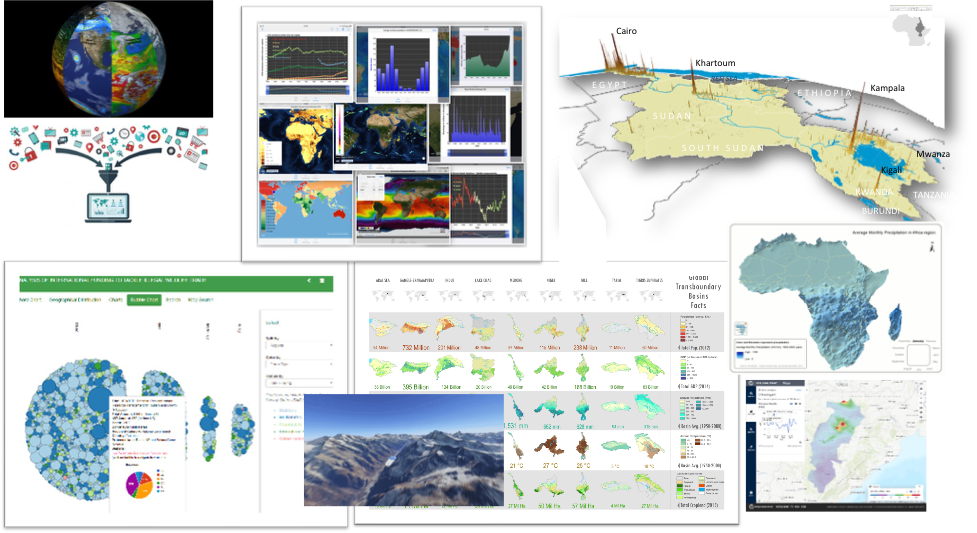
There are also ways of developing ways of packaging interactive maps into e-Atlases. Some examples
of these
being prototyped by the World Bank include:
- World Bank Global Reach Spatial Agent Global Portal for
Water:
http://www.appsolutelydigital.com/GlobalReach/map.html - Sudan: http://www.appsolutelydigital.com/Sudan/index.html
- Indonesia: http://www.appsolutelydigital.com/Indonesia/index.html
- Western Balkans: http://appsolutelydigital.com/WestBalkans/cover.html
- Central Asia: http://www.appsolutelydigital.com/CentralAsia/cover.html
- Africa Regional: http://www.appsolutelydigital.com/AfricaAtlas/cover.html
- Senegal: http://www.appsolutelydigital.com/Senegal/cover.html
- Nepal: http://www.appsolutelydigital.com/Nepal/cover.html
- World Bank Global Reach Spatial Agent Global Portal for
Water:
Modeling
Modeling is a way to simplify the processes of reality to better represent the state of current knowledge in terms of inter-relationships across various variables. For example, these would be used to determine pollution or sediment loads of upstream catchments into coastal systems or to better forecast rains, storms or coastal flooding. These are now rapidly moving from traditional desktop computers to online cloud-based systems.
Traditional approaches to analytics (that are still in vogue today) include a range of often proprietary and expensive desktop modeling tools even to get simple insights into systems. These often have specific data input formats and inflexible hard-wired interfaces and outputs in terms of tables and visuals.
A new world of online analytics based on increasingly open-source inter-operable standards is changing all this rapidly. There are online platforms that convert static datasets into online data services that can be analyzed using online (and often open-source) scripts using python, R, javascript and other common frameworks to undertake extremely powerful analytics on these online data services. They also interface with a growing range of increasingly free (or low-cost subscription services) for powerful data visualization with highly-interactive maps, graphs, animations, schematics, or other visualizations that can be access on multiple digital devices.
There are new paradigms evolving to reusing code so that people can better leverage each others’ work and not re-invent the wheel. This includes the development of scripts or pieces of code that are well-documented and open-source to promote their reuse and continuous development. There are tutorials or guided instructions to discover and visualize new data or information in Python or R scripts stored onGitHub,GitLab, or BitBucket such as NASA or Planet. In addition, some journals such as Nature require the code to be posted to demonstrate reproducibility. The posted code allows other researchers or scientists to build upon the original author's work. These scripts have become excellent enablers of a new generation of open-source ecosystem. These are also the case on free systems that may not be fully open-sources such as Google Earth Engine with has reusable code repositories and communities of practice.
Google Earth Engine (GEE) is an innovative cloud-based platform from Google provides access to multiple repositories of satellite imagery and geospatial datasets allowing quick and accurate analysis and visualization of large datasets available in the cloud, the datasets include free geospatial data, optical and radar satellite imagery, climate information, digital elevation models, land cover maps and a variety of socio-economic variables.
These allow for analytics at a speed unimaginable even a few years ago and help usher in a new age of well-structured open data services and free analytics and visualization that are set to disrupt the world of informatics for the Blue Economy.
Visualization and E-Packaging for User Interaction
There are a range of new opportunities to leverage modern technology to interactively visualize data of any type – and the spatial and temporal data that is common in hydroinformatics is no exception.
There are many tools that we can use to create interactive online dashboards using a range of free and commercial tools (note that even commercial tools usually have free versions for smaller datasets). These allow us to create and publish interactive maps, charts, animations for use in dashboards or interactive e-documentation.
Interactive E-books/Story Maps: It is possible today to create more interactive e-packaging of materials to dramatically change the user experience from reading hardcopy or static digital documents. This Hydroinformatics e-book is an example of e-packaging into an interactive document where the user can access a world of knowledge generated from multiple institutions using the evolving interoperability of systems that allows us to embed accessible videos and other multi-media as well as interactive charts, maps, and other datasets into a narrative. It would be useful for most documents and reports (e.g., State of Environment Reports, Stakeholder Assessments, Basin/Watershed Profiles) to become more interactive in the future to allow users to interact and go deeper into any topic as well as benefit from central updating and being able to quickly access the e-packaged resource from any device (e.g., smartphone, tablet, computer).
Data & Analytics Dashboards: A special form of e-packaging is to be able to access, analyze, and visualize complex data in a highly interactive manner through customized dashboards. For example, as a companion to this eBook, we have created a HydroInformatics Data & Analytics Catalog to help visualize some examples of a growing world of free, public-domain data and analytic services mostly covering the whole world.
These can include tools to do online analytics that leverage interoperability based on common data standards, open-source approaches, and open data and scripts. For example, in the interactive map below, you can zoom into any area you like (even globally), change background maps that give you scale-dependent services from different institutions using interoperable standards, and if you click on any point (e.g. on a river emptying into a coast), it will outline the corresponding watershed (using an ESRI script using the STRM global elevation data that was collected on a space shuttle mission a couple of decades ago) and showing this on an open-source environment (leaflet in this case).
As touch devices from smartphones and tablets are becoming common, touch screens and touchtables are being used more to engage stakeholders. Touch interface facilitates knowledge exchange by turning on and off geospatial layers, swiping tools, drawing, and placing ideas on a map. In addition, a touch interface can allow for more than one person to interact with the data simultaneously and display the results from the user interaction. Hence, touch devices allow for collaboration and brainstorming that does not exist with a mouse or keyboard or fully engage stakeholders with a paper map.
Virtual Reality (VR) technologies are a rapidly-evolving technology increasingly being used in projects across sectors, enabling virtual tours and training all around the world. By providing effective and efficient visualization of the real world such as the data relevant to the Blue Economy, VR has become an innovative way of communicating with stakeholders and facilitating accelerated learning and remote networking. It provides water engineers, infrastructure managers, policymakers, development practitioners, and anyone to experience the real world and identify challenges virtually. Applications could range from interactive 360 o videos to more complex immersive visualization of data or training material. They could help individuals in different locations to interact virtually while exploring some 3D information. Imagine if you could spin a globe to explore historical or near real-time water cycle information in any part of the world, or work with global experts to study a dam or a flooded area, or make this part of a “digital twin” of a water infrastructure asset.
Augmented Reality (AR) enables the digital projection of information on to the real world. It can take people inside the field and identify issues and mechanisms. These have become popular by apps that help you leverage a smartphone camera to view imaginary creatures or objects in a room. These can also be used to project hydroinformatics information onto schematics or actual systems or help visualize a watershed or a LiDAR survey in your room.