5.1 - Le profil de risque du Burundi
Globalement, par rapport à l'est, la partie occidentale du Burundi est plus exposée aux risques climatiques suivants : précipitations totales annuelles moyennes, inondations pluviales et fluviales, nombre maximal de jours secs consécutifs, instabilité des pentes entraînant des glissements de terrain et risque accru d'érosion des sols (voir la figure 4).
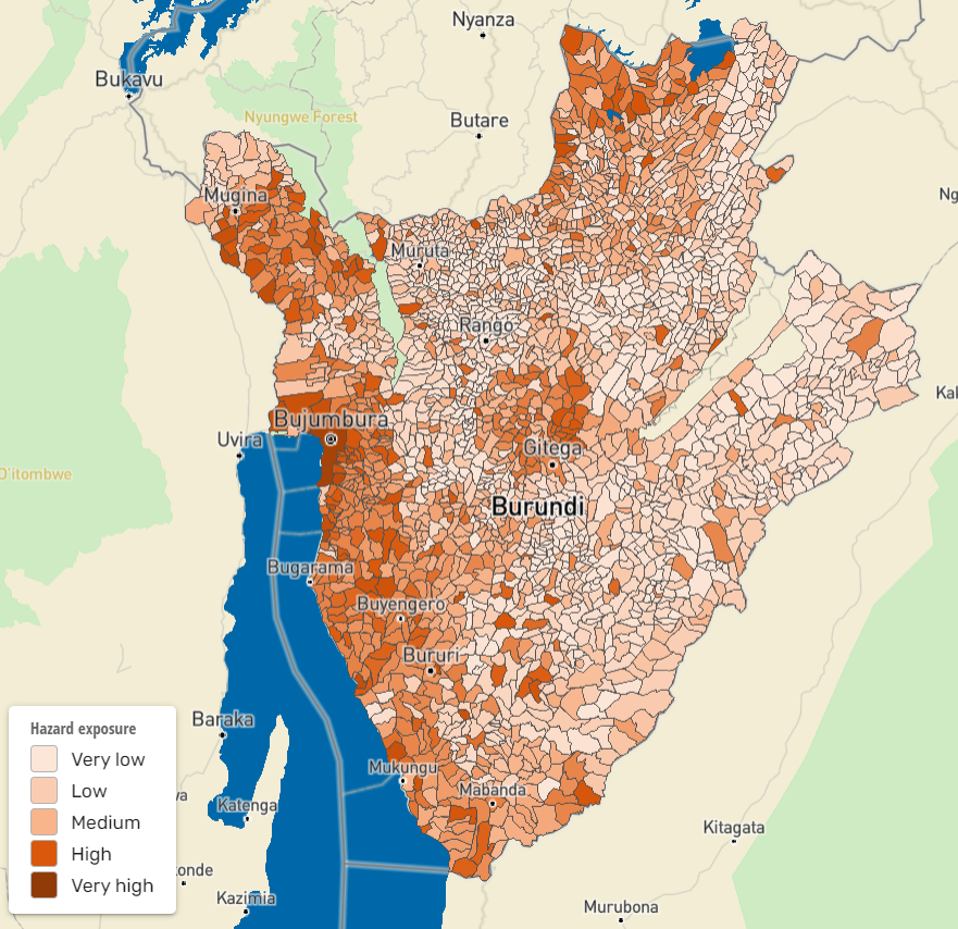
Figure 4. - Score composite de danger et d'exposition
La distribution spatiale de la vulnérabilité au Burundi est homogène, le nord et l'ouest du pays étant extrêmement vulnérables, tandis que le sud et l'est ainsi que la zone autour du lac Tanganyika ont un score d'indice de vulnérabilité plus faible (Figure 5).
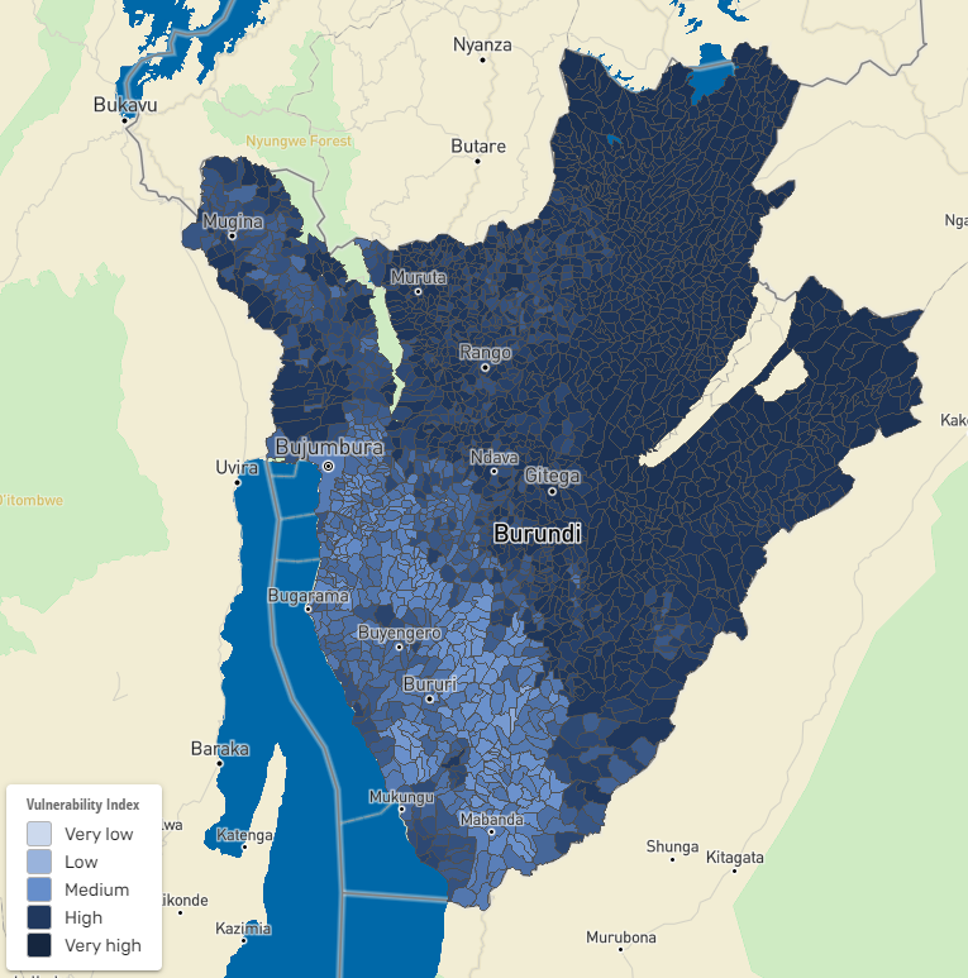
Figure 5. - Score composite de vulnérabilité
En raison des conflits de nature prolongés, de la violence, de la fragilité et de l'extrême pauvreté, la capacité d'adaptation des individus et des ménages reste très élevée dans les paysages de colline du Burundi (Figure 6).
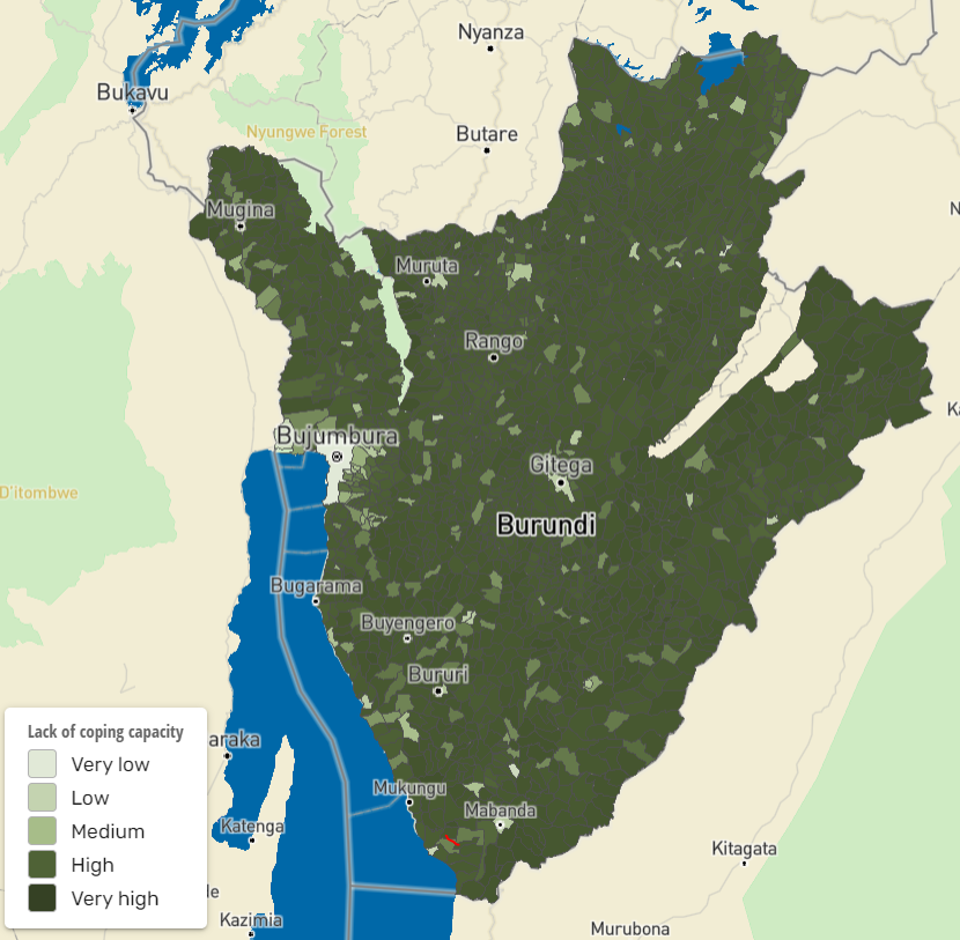
Figure 6. - Score composite de manque de capacité d'adaptation
5.2 - Climate Change Impacts in Burundi
5.2.1 - Temperature
Burundi has experienced a general warming trend in mean annual temperatures since 1979, with a trend of 0.31°C [0.18–0.41°C] per decade and, consequently, the coldest night temperatures have decreased while the hottest day temperatures have increased (Figure 7).
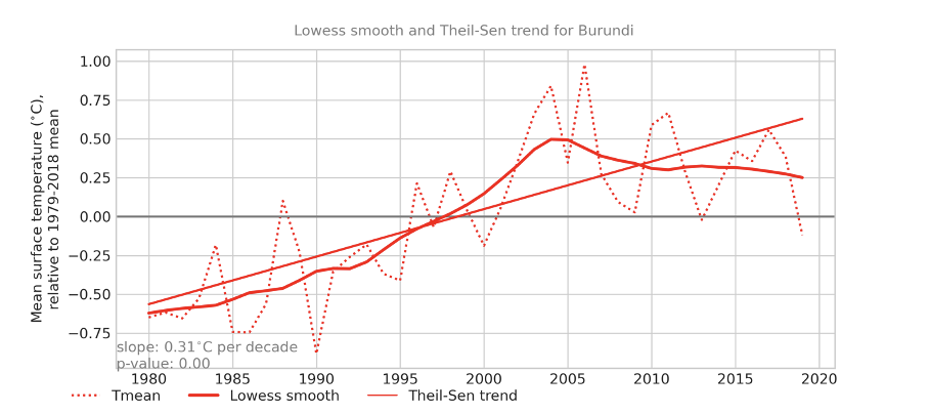
Figure 7. - Long-term trends and variability in annual mean temperature anomalies (data: WFDEI-CRU)
From near- to mid-future, temperatures are projected to increase by ~0.5°C under the RCP 4.5 scenario and ~1°C under the RCP 8.5 scenario. Lower temperature increases are more likely under a low emissions scenario and higher temperature increases are more likely under a high emissions scenario. For Burundi, there is high model agreement that temperatures are projected to increase (Figure 8).
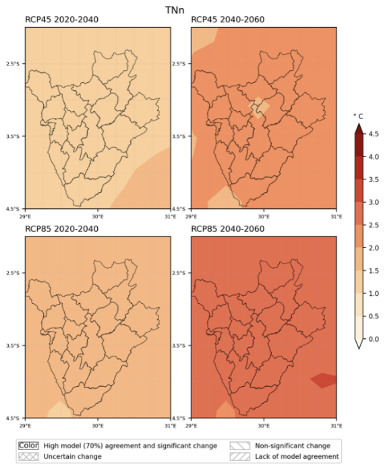
Figure 8a. - Coldest night (TNn)
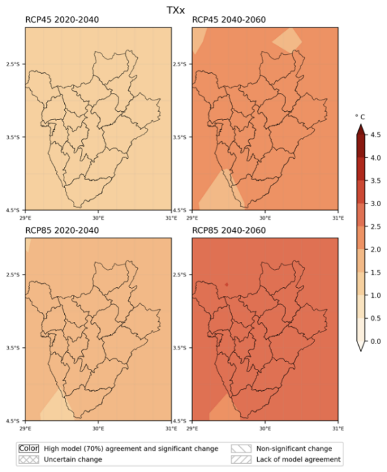
Figure 8b. - Hottest day (TXx)
Figure 8. - The multi-model mean of temporally averaged changes in the minimum of minimum temperature (TNn, (a) coldest night) and the maximum of maximum temperature (TXx, (b) hottest day) over the time period 2020–2040 and 2040–2060 displayed as differences (in °C) relative to the reference period (1981–2000) for RCP 4.5 (top) and RCP 8.5 (bottom).
5.2.2 - Precipitation
Rainfall – including intense rainfall events – throughout Burundi’s watershed region has been dominated by natural variability. Therefore, no statistically significant long-term trends can be detected. However, the area has been subject to intense rainfall events over the years, and the trend is expected to increase over time (Figure 9).
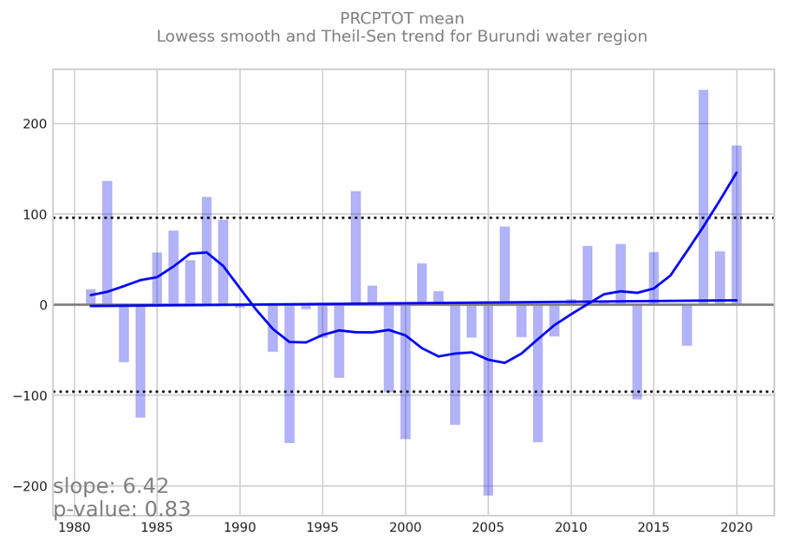
Figure 9. - Long-term trends and variability in total mean annual rainfall anomalies, PRCPTOT. The dotted horizontal line represents one standard deviation from the mean. The curved line represents the lowess smooth (data: CHIRPS)
Despite model uncertainty, there is a consistent pattern of wetting in the northern region and drying in the southern region of Burundi. However, these changes are not robust for the majority of Burundi as there is lack of model agreement and the changes are not statistically significant, i.e., the changes are masked by natural variability. The changes in future precipitation are robust over Rutana province as well as the southern provinces of Ruyigi and Gitega for both periods and scenarios considered (Figure 10).
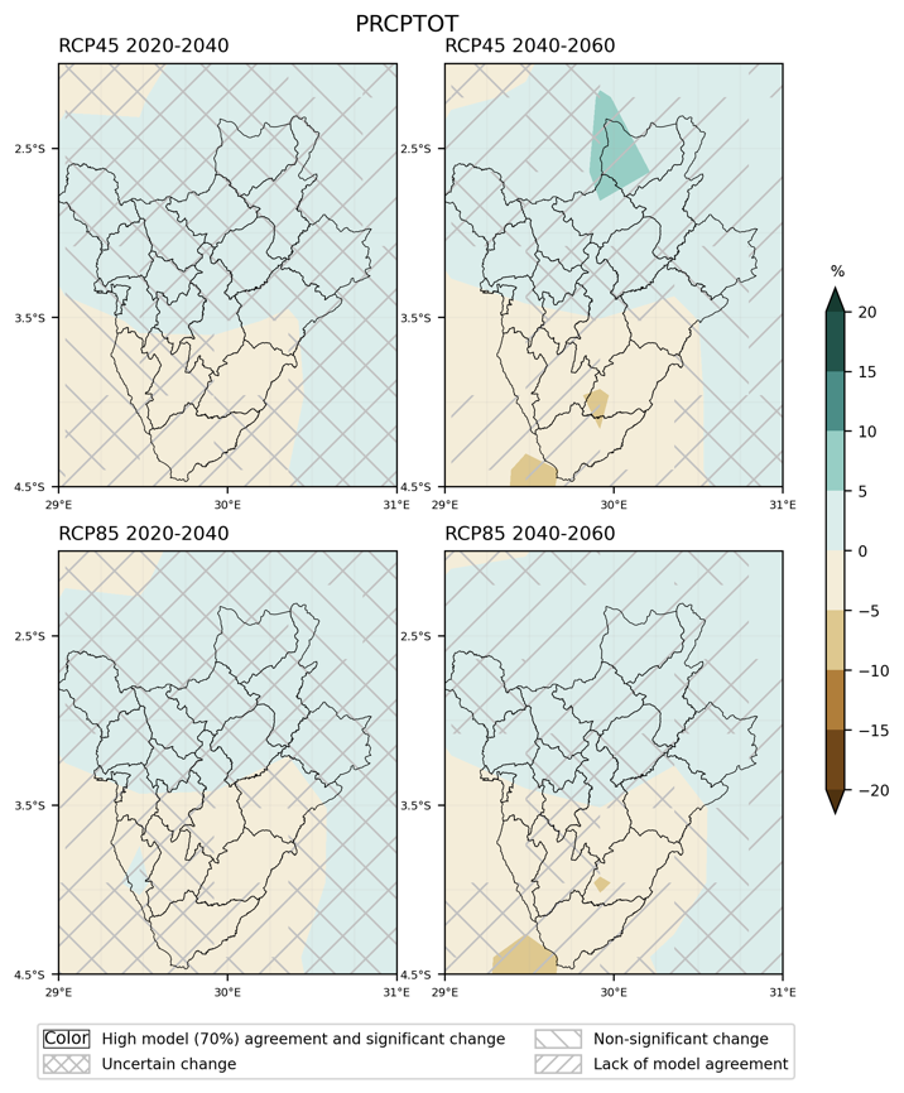
Figure 10. - The multi-model mean of temporally averaged changes in mean annual total precipitation (PRCPTOT) over the time period 2020–2040 and 2040–2060 displayed as differences (in %) relative to the reference period (1981–2000) for RCP 4.5 (top) and RCP 8.5 (bottom).
Besides temperature and precipitation first-order hazards, Burundi is highly vulnerable and historically affected by multiple compounded second-order or cascading climate change hazards such as floods, landslides trigger by intense precipitation events, storms, droughts, and wildfires (Figure 11).
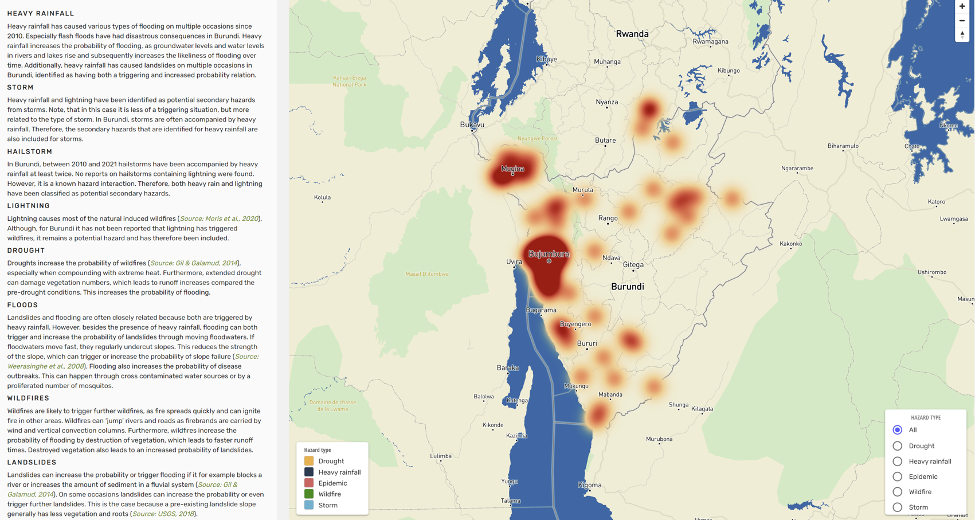
Figure 11. - Cascading climate change hazards such as floods, storms, droughts, and wildfires
5.3 - Flood Risk as a Key Driver of Forced Displacement
The results of the spatial multi-criteria evaluation (SMCE) approach highlighted that Burundi’s landscape and population are highly susceptible to fluvial and pluvial flood risk. Overall, the western and eastern borderline areas of the country are the identified hotspots to both riverine and precipitation-induced flood hazards. Nationally, 11 percent of Burundi’s landscape was classified under the model’s ‘highest’ risk zone, 13 percent under ‘high’ flood-prone areas, 46 percent ‘moderate’, 25 percent ‘low’, and only 5 percent of the country’s total landmass was classified as ‘lowest’ flood risk areas (Figure 12). Population and infrastructure exposure to flood risk is highest in several urban areas including but not limited to Bujumbura city, Bujumbura Rural province (e.g., Mushasha), Bubanza province (e.g., Ruyange, Gifurwe), Cibitoke province (e.g., Buganda), Makumba province (e.g., Mukungu) among many others (Figure 13).
Urban flood risk is predominantly due to the increased presence of impervious surfaces and crowded human settlements, often without proper stormwater infrastructure systems. Urban flooding claims people’s lives, threatens the sources of their livelihood, and damages private properties and public infrastructure in many developing countries. For example, in Burundi, between November 2015 and January 2016, heavy rains and floods destroyed 5,068 houses, affecting 30,408 persons. In addition, rising exposure of agricultural lands to flood risk in rural areas might increase food insecurity risk and “food sovereignty” threats (referring to communities’ inability to grow what they eat and eat what they produce).
Flooding significantly contributes to internal forced displacement of thousands of people since the beginning of 2020 and may exacerbate pre-existing poverty and public health issues. Recently, “in Bujumbura city in Bujumbura Mairie, riverine flooding displaced 27,000 people (ECHO 22/04/2020). In Bujumbura Rural, the Ruzizi River burst its banks, leading to the flooding of up to 7,600 homes (IOM 22/04/2020). In Mutimbuzi commune, in Bujumbura Rural province, the river flooded six districts of Gatumba city, including Kinyinya 1 & 2, Muyange 2, Mushasha 1&2, and Gaharawe, displacing up to 40,000 people according to available estimates (IOM 22/04/2020)”. Similarly, Lake Tanganyika water level has been rising since February 2021. Consequently, according to UNOCHA, in April 2021, over 8,000 families (47,362 individuals) affected by flooding in only four provinces (Bujumbura rural and town, Rumonge, and Karamba), leading to the displacement of 2,000 people in lakeside communities, including Bugarama, Kanyenkoko, Muhuta, Nyanza-Lac, Gatumba, Rukaramu, Kibenga, Gisyo and Kabondo. The abovementioned locations all fall under ‘highest’ to ‘high’ flood risk zones identified by our model. We do not have a complete flood map of all previously affected areas in Burundi, but sample maps published by different groups validate the accuracy of our flood hotspot locations (see Appendices 1-3, Climate Centre et al., 2021).
Recent flooding from the rising waters of Lake Tanganyika at Bujumbura port in Burundi has affected 8,000 families with around 2000 people displaced
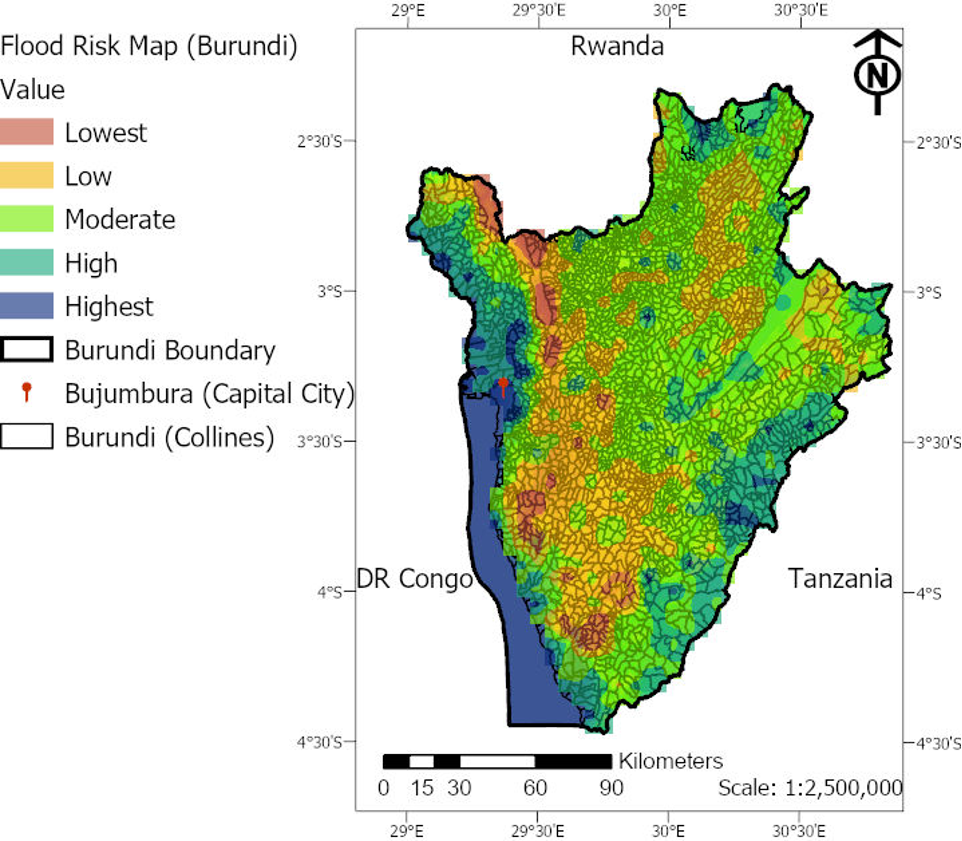
Figure 12. - Landscape and population exposure to flood risk in Burundi. Note: This map represents only the landscape vulnerability and population exposure to flood risk.
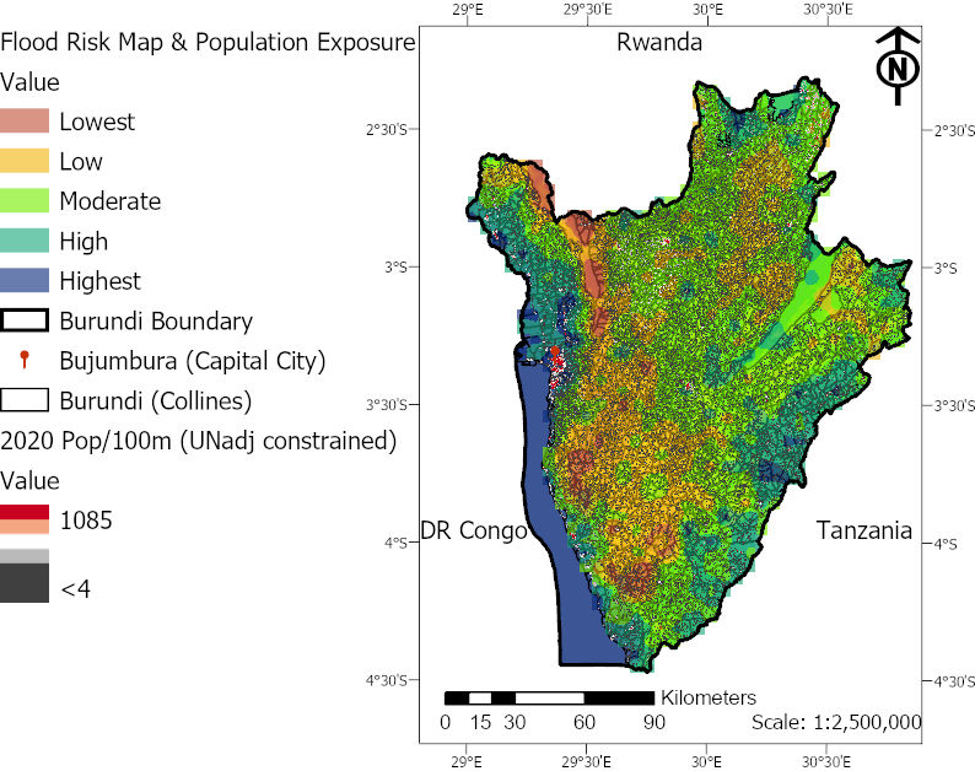
Figure 13. - Population exposure to flood risk zones. The map presents the national hotspots of landscape and population exposure to flood risk.
Days of torrential rains have caused flooding in Burundi's capital, forcing families to abandon their homes for dry ground
5.4 - Landslide and Soil Erosion Risk
As introduced above, Burundi’s collines are vulnerability to landslide, land degradation, and soil erosion risks (Figures 14, 15, 16, 17, and 18). The hazards increase people, agriculture, and transportation networks’ vulnerability to climate-induced risks. For example, Bujumbura Mairie, Bujumbura Rural, Cibitoke, and Rumonge have the highest scores across erosion and landslide hazards metrics considered, and they also have high scores for NBS potential (Table 2). This means that there is a strong opportunity for land management practices there to contribute significantly to mitigating these hazards.
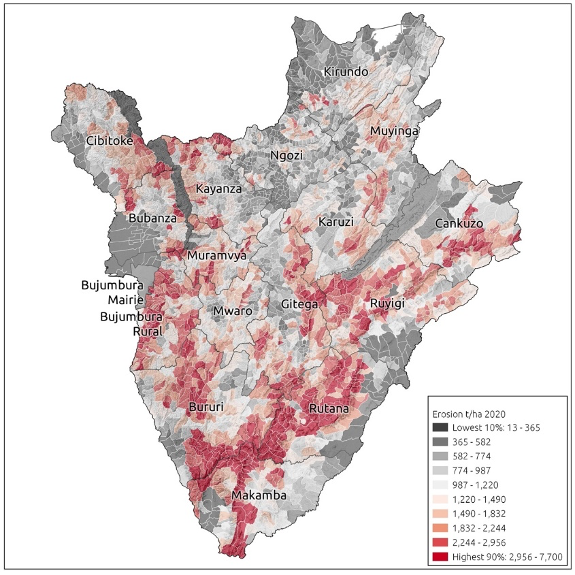
Figure 14. - Erosion (SDR) model results for the baseline land cover (2020), by colline.
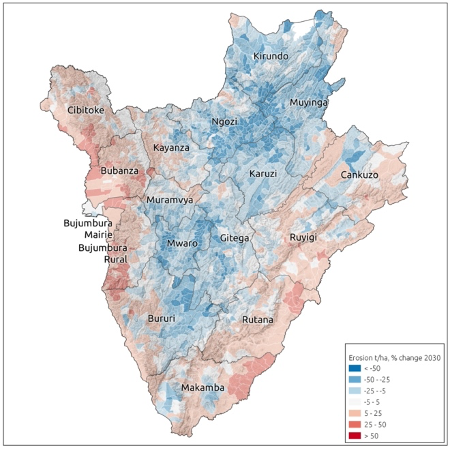
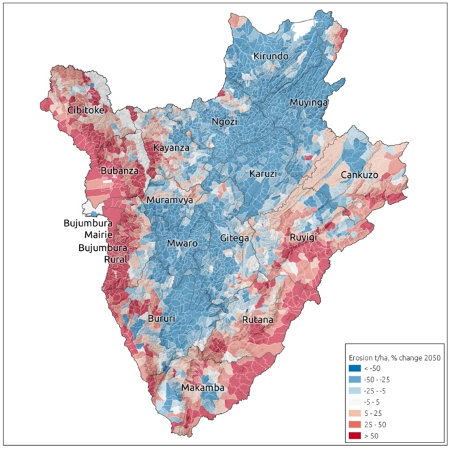
Figure 15. - Erosion trends by colline, shown as relative change from 2020 to 2030 (left) and to 2050 (right). Relative changes in 2030 range from a decrease of 60% to an increase of 69%, and in 2050 these range up to a maximum of more than 200% increase in sediment.
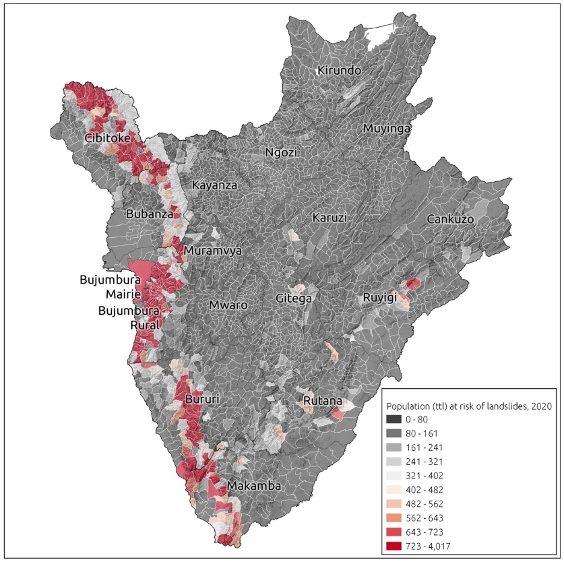
Figure 16. - Population (total) at risk from landslides, as modeled in this study
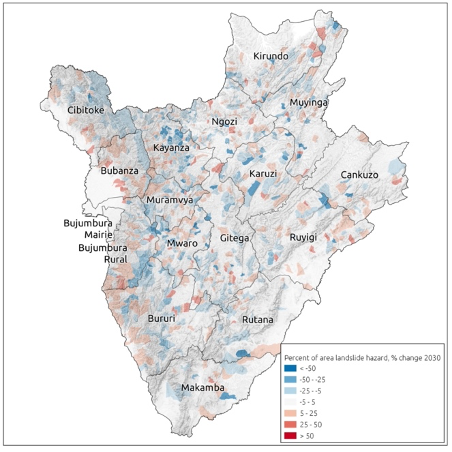
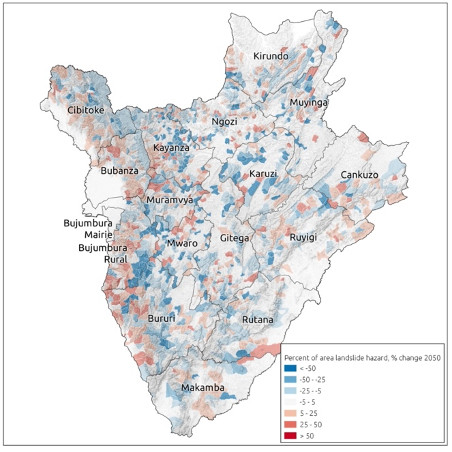
Figure 17. - Landslide and runout hazard trends by colline, shown as relative change from 2020 to 2030 (left) and to 2050 (right)
Landslides in Burundi country (French)
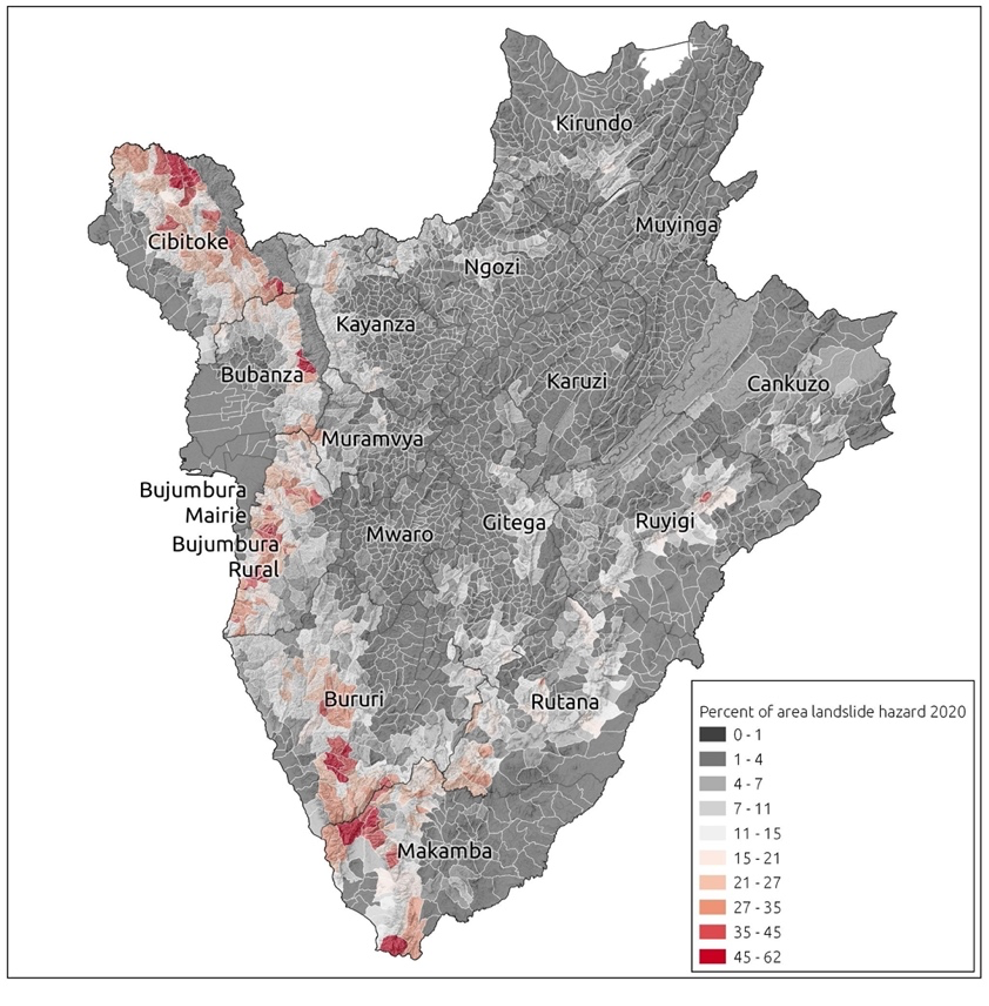
Figure 18. - Combined landslide and runout hazard areas for the baseline (2020) land use, by colline
The commune-level multi-hazard (landslide and erosion) results in (Table 2), as well as the colline-level scores in (Appendix 6.1. Stanford Natural Capital Project et al., (2021)) are provided to support prioritization of where landscape management activities to address land degradation, soil loss, and landslides should be implemented.
Table 2. Commune-wise mean scores for the Multi-hazard Index and the Nature-based Solutions (NBS) Potential Index. In the second column, higher values represent communes at higher risk of landslide and erosion risk. In the third column, higher values correspond to communes where NBS has the most significant potential.
|
Commune name (admin level 1) |
Multi-hazard Index MEAN |
NBS Potential Index MEAN |
|
Bujumbura Mairie |
0.48 |
0.48 |
|
Rumonge |
0.48 |
0.42 |
|
Bujumbura Rural |
0.44 |
0.39 |
|
Bubanza |
0.42 |
0.36 |
|
Cibitoke |
0.42 |
0.45 |
|
Makamba |
0.33 |
0.30 |
|
Rutana |
0.30 |
0.22 |
|
Ruyigi |
0.28 |
0.21 |
|
Bururi |
0.28 |
0.29 |
|
Cankuzo |
0.27 |
0.18 |
|
Kayanza |
0.27 |
0.22 |
|
Muramvya |
0.27 |
0.23 |
|
Gitega |
0.23 |
0.20 |
|
Kirundo |
0.22 |
0.21 |
|
Ngozi |
0.21 |
0.20 |
|
Karuzi |
0.20 |
0.18 |
|
Muyinga |
0.19 |
0.16 |
Collines in Bubanza, Bujumbura Mairie, Bujumbura Rural, Cibitoke, and Rumonge have the highest density of roads at risk from landslides and high NBS potential, and so represent opportunities to involve the transport sector (roads) in designing and coordinating landscape management activities that can mitigate these hazards (Figures 19). Figure 19 shows collines where most roads are under landslide and runout hazards and where these hazards have increased over the 20 years. The destruction of infrastructure by extreme climate events hampers economic development in Burundi.
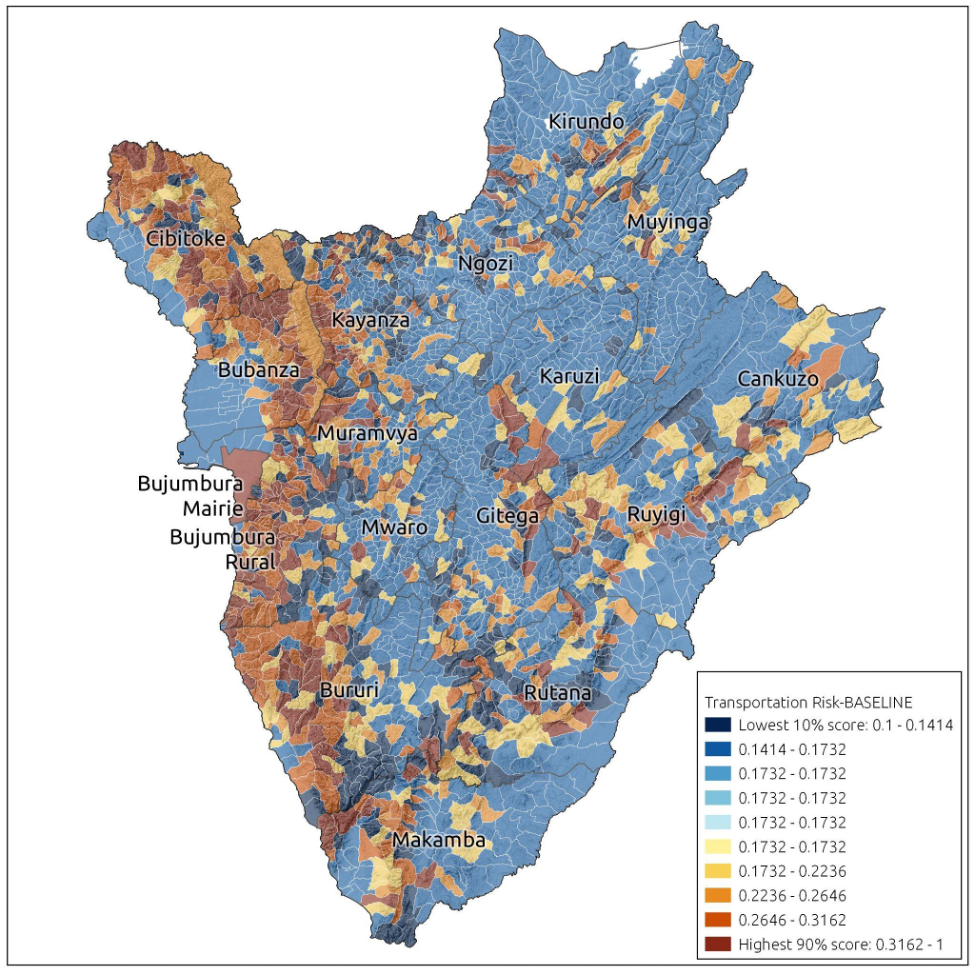
Figure 19. - Transportation networks at risk from landslides. Transportation risk index, showing collines where the most roads are under landslide and runout hazards, and where these hazards have been increasing over the 20-year period.
Landslides in Burundi have killed at least 10 people after torrential rains, a local governor said Monday, revising downwards an earlier toll after eight were found alive
In terms of NBS, collines in Bubanza, Bujumbura Mairie, Bujumbura Rural, Cibitoke, Rumonge, and Makamba represent the greatest opportunities to engage the agriculture sector in employing NBS to mitigate land degradation and erosion that threaten food and livelihood security (Figure 20). Figure 20 shows collines with the greatest area of croplands at risk of erosion and landslides, and where these hazards have been increasing most over the 20-year period.
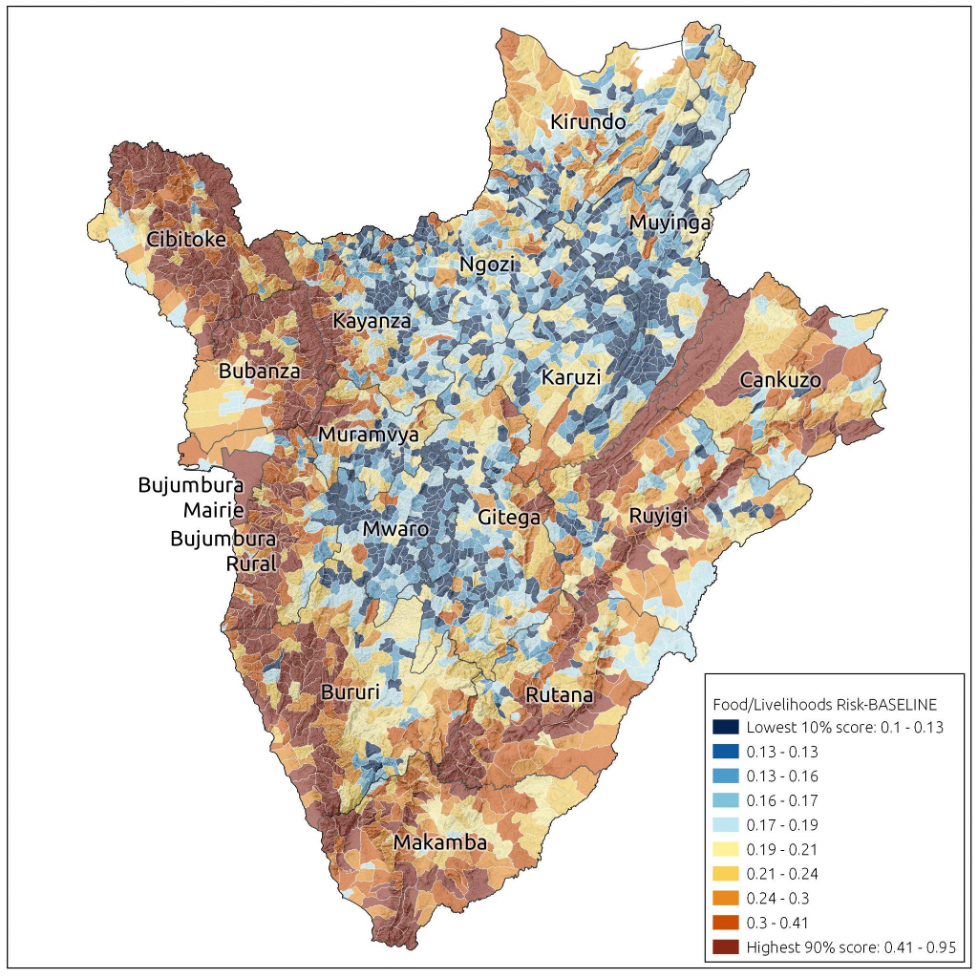
Figure 20. - Food Production & Livelihoods at Risk from erosion and landslides. Food & livelihoods risk index, showing collines with the greatest area of croplands at risk, and also where these hazards have been increasing most over the 20-year period.
5.5 - Conflict, Violence and Forced Displacement
In Burundi, poverty, conflict, and forced displacement are heavily driven by climate change impacts, natural resource dependence, and environmental fragility (Figure 21). Based on the interviews and literature study, it also became clear that land plays a critical role in the lives of many Burundians. While land scarcity is already causing conflict, our report suggests that conflicts concerning land will remain or might even increase in the future. Climate projections indicate that higher temperatures in the future will lead to increased evaporation affecting agricultural productivity. Assuming land availability will remain the same, expanding is not a realistic solution to keep agricultural outputs comparable. Hence, it is expected that land will remain a continued source of conflict in Burundi. The analysis of geographic locations of people affected by conflict overlaid with areas where people are especially vulnerable to climate hazards. Our report finds that several flood-prone areas geographically overlay with identified conflict-affected hotspots, for example, in Bujumbura capital city and the provinces Bujumbura Rural and Rumonge.
All interviewees consulted by Climate Centre et al. (2021) marked Bujumbura capital city as a conflict and violence hotspot. Bujumbura has been described as the area with the highest conflict intensity as well as with the highest population density, thus exacerbating civilians’ vulnerabilities to climate-induced hazards and further identified conflict-affected hotpots in the provinces of Cibitoke, Rumonge, Bubanza, Bujumbura Rural, and those provinces along the border regions with the DRC. Even though we cannot conclude that these conflicts are climate-driven, evidence suggests that climate change impacts contribute and will increase the likelihood of triggering many types of conflicts in Burundi, including but not limited to violence over scare natural resources such as water, fisheries stock, and arable land. Similarly, climate change impacts could intensify civil and political unrest, domestic tensions, gender-based violence as well as violence against the most vulnerable population subgroups.
Several climate hotspot collines and provinces are also locations of internally displaced people (IDPs) and refugees, emphasizing the complexity of these multi-risk hotpot settings and the overall vulnerability people face as a direct result of climate change impacts. Since 2015, Burundi has experienced unprecedented forced displacement (127,832 IDPs in 2020), and more than 413,0000 Burundians fled to neighboring countries (Tanzania, Rwanda, The Democratic Republic of the Congo, and Uganda). Climate-related disasters account for 83% of these forced displacements, with the remaining 17% caused by the fragile socio-economic situation. Climate change compounds pre-existing risks through rising rainfall/temperature variability projected to worsen by 2030-50 (see Climate Centre et al., 2021 Report). According to one interviewee, internal displacement pushes people to reside in the wilderness/nature instead of living in their villages. This displacement impacts the environment, as they heavily depend on natural resources to meet their survival needs. For example, they cut down trees for firewood and to build shelters; these activities, in turn, impact the soil. Further analysis of the impact of conflict and displacement vis-à-vis natural resource utilization and environmental costs to society is recommended.
More than 25,000 people in Burundi have been forced from their homes after Lake Tanganyika rose to nearly historic levels, flooding multiple western provinces.
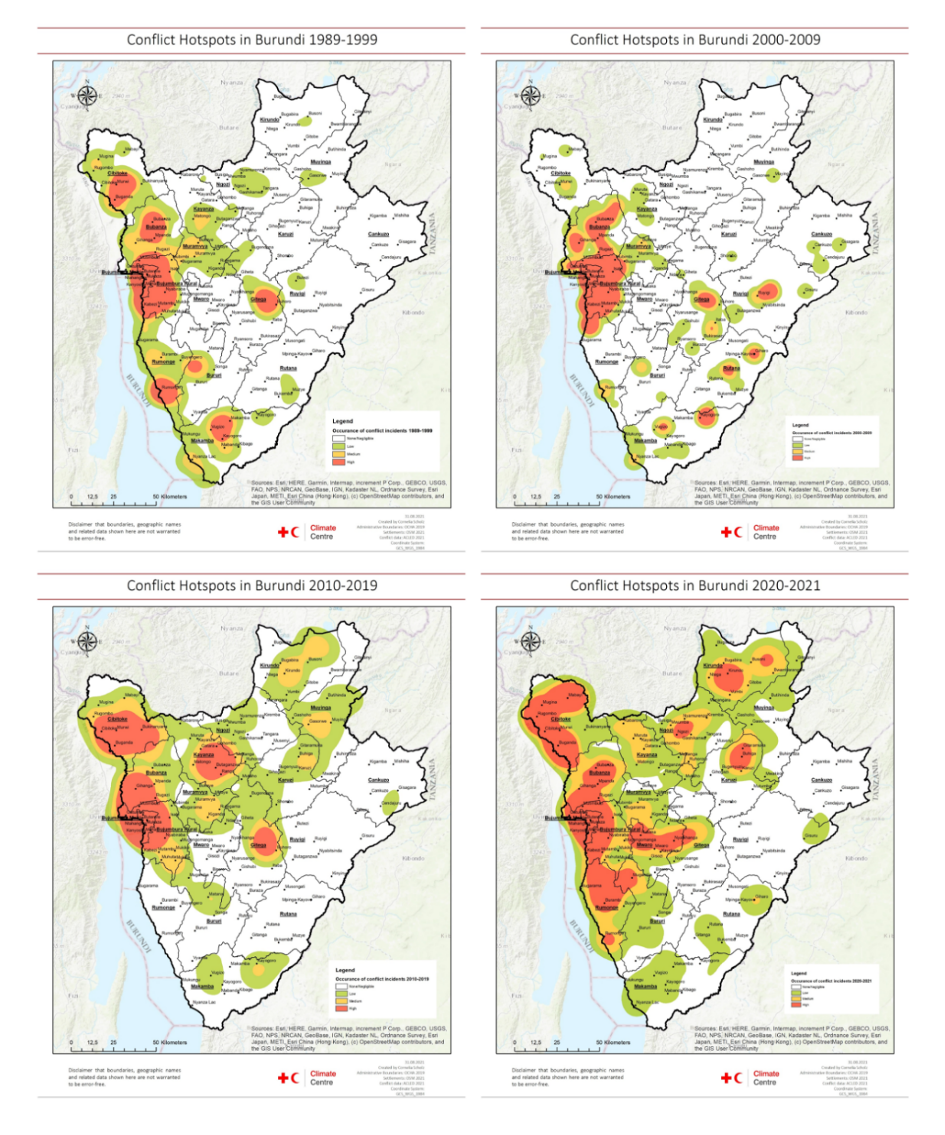
Figure 21. - Geographic locations of hotspots of conflict periods between 1989–2021. The classification of conflict hotspots indicates at which geographic areas occurring conflicts were concentrated for each time period. Please note, the images do not represent absolute numbers of incidents and their intensity across time periods, but visualize locations of hotspots relative for each time period. Source: Own diagram; data: UCDP 2021; ACLED 2021.