Spatial Platforms
There have been many advances in recent decades in Geographic Information Systems and Remote Sensing since the early days of GIS in the 1980s. You can find a quick overview of GIS and remote sensing at this link.
One of the most exciting areas of modernization in relation to data has been in terms of new ways to integrate and visualize the data on spatial platforms. Being able to visualize, manipulate and analyze spatial data is paramount to watershed management, given that many, if not all, aspects of basin management – climate, water resources, water use, landuse, etc. - depend on spatial relationships. There are a number of popular software that have been developed for undertaking GIS, remote sensing or other spatial analysis. Spatial tools for forestry management are included in commercial or open source Geographic Information System (GIS). Commercial GIS software has license restrictions, does not publish the underlying code and charges a licensing fee, but is often better streamlined. Open source GIS software publishes the underlying code, has less restriction on licensing and is free to use for commercial purposes, but is often less streamlined. An illustrative (but non-exhaustive) list of some popular open source and commercial software that can support forest management (e.g. spatial analysis, visualization, integration of GPS and other field data, etc.) include:
- Google Earth is a very popular way to get free 3-D high-resolution spatial perspectives on any watershed around the earth. It can now be accessed directly in a Chrome browser at http://earth.google.com or downloaded as a desktop version Google Earth Pro at the same site. It allows easy visualization of high-resolution satellite imagery timeseries draped over a 3-D model of the earth and also allows integration of GIS, animations, photos, videos, 3-D models, or other objects into the visual experience, along with fly-throughs of watersheds that can be shared as links or video files.
- Quantum (QGIS) GIS is a free open source program licensed under GNU Public license, QGIS is user friendly and provides a lot of documentation for beginners, it is also one if not the most widely used open source GIS software. QGIS is regularly updated and the code is maintained by a large group of developers. Furthermore, other programs on the list can be added to the QGIS toolset. QGIS can read most vector and raster file formats as well as all the common geodatabase and web map services. QGIS composer can produce maps from various layers.
- System for Automated Geoscientific Analyses (SAGA) GIS is a free open source program licensed under GNU Public license. SAGA GIS is a spatial modeling GIS program for intermediate to advanced users in spatial modeling. Users should note that SAGA GIS could be used as part of QGIS or R. SAGA GIS’s strength is in spatial statistics analysis, namely spatial sampling, interpolation and modeling. All SAGA tools can be used to predict forest fire as well as forest health risk indicators.
- Geographic Resources Analysis Support System (GRASS) GIS is a free open source program licensed under GNU Public license. GRASS GIS is for advanced users, preferably with experience in GIS and image processing. GRASS GIS is best used for raster analysis. GRASS computes various raster analyses such as Leaf Area Index (LAI), Normalized Difference Vegetation Index (NDVI) or forest fragmentation analysis.
- R + spatial packages (sp, rgrass7, raster, rgdal, spdep, rgeos) is a free open source program licensed under GNU Public license. R is a statistical scripting environment and includes many geo statistical analysis packages. R has a steep learning curve and is for advanced users with experience in GIS, spatial data analysis and python or another language. Albeit extremely versatile, R strength lies in script automation and statistical analysis. Shiny provides web-based support for R.
- IDRISI is a popular image processing software with a suite of associated tools primarily for raster data analysis.
- Environmental Systems Research Institute (ESRI) is an industry leader for commercial GIS systems (e.g. ArcGIS), used in over 350,000 organizations around the world. They also have free online GIS viewers. There are also a number of growing applications in forestry.
- Intergraph and Hexagon have a range of commercial geospatial software (e.g. ERDAS IMAGINE, GEOMEDIA) that are popular for remote sensing and GIS use.
- Harris has a number of products such as ENVI that are very popular for remote sensing analysis.
- Explore here to get more of a flavor for the large number of firms and open-sources and commercial spatial analytical products that could be useful in watershed management.
Looking ahead, there are a few new types of technologies that show immense promise for revolutionizing watershed analysis:
- Systems integration of existing software to create powerful new tools. For example, Collect Earth is a tool that combines the power for Google Earth, Bing Maps, and Google Earth Engine to facilitate data collection (E.g. to support multi-phase National Forest Inventories) – the data is also exportable to Saiku to facilitate data analysis.
- Machine Learning is a rapidly-evolving artificial intelligence discipline that helps systems to learn without being explicitly programmed – i.e., which can adapt the programs when exposed to new data.
- Virtual Reality or Augmented Reality may look like science-fiction now, but at the rate at which these technologies are being deployed, it will be relatively soon when one can visualize and interact with watershed development and climate scenarios in a completely different way than we currently do.
- Google Earth Engine is a radically new approach to spatial analysis, combining a growing catalog of free, public-domain satellite imagery and geospatial datasets with cloud computing and collaborative platforms. Some Google Earth Engine applications that are particularly interesting from a watershed perspective include:
- Spatial Agent
is an
innovative mobile App from the World Bank that seeks to showcase a growing set of
public-domain data from thousands of online mapping and data services. New versions include cloud
analytics
(e.g. computation of NDVI from MODIS or Landsat or CHIRPS rainfall data analysis) using the Google
Earth
Engine
API. This helps bring a world of information and analytics at one’s fingertips when exploring or
analyzing
watersheds around the world.
-
There are also ways of developing ways of packaging interactive maps into e-Atlases. Some examples
of these
being prototyped by the World Bank include:
- World Bank Global Reach Spatial Agent Global Portal for
Water:
http://www.appsolutelydigital.com/GlobalReach/map.html - Sudan: http://www.appsolutelydigital.com/Sudan/index.html
- Indonesia: http://www.appsolutelydigital.com/Indonesia/index.html
- Western Balkans: http://appsolutelydigital.com/WestBalkans/cover.html
- Central Asia: http://www.appsolutelydigital.com/CentralAsia/cover.html
- Africa Regional: http://www.appsolutelydigital.com/AfricaAtlas/cover.html
- Senegal: http://www.appsolutelydigital.com/Senegal/cover.html
- Nepal: http://www.appsolutelydigital.com/Nepal/cover.html
- World Bank Global Reach Spatial Agent Global Portal for
Water:
Fresh Water Ecosystems
A partnership of the UNEP, Google, and the European Commission’s Joint Research Centre (JRC), together with NASA, and the Group on Earth Observations (GEO). Fresh Water Ecosystems provide accurate, up-to-date, high-resolution geospatial data depicting the extent freshwater ecosystems change over time. Google will periodically produce geospatial maps and data on water related ecosystems, using massive parallel cloud computing, the open access format of the Fresh water Ecosystems will drive more action into protecting and restoring freshwater ecosystems and for countries to track their progress towards, achieving the Sustainable Development Goal Target, 6.6. water data is available on national, subnational and basin levels.
Desktop Modeling
Modeling is a way to simplify the processes of reality to better represent the state of current knowledge in terms of inter-relationships across various variables. In the context of a watershed, modeling can be of many types, including:
Water Balance/Hydrologic Modeling:Accounting for what happens to the hydrologic cycle elements of a watershed in terms of rainfall, evaporation, transpiration, surface flow, infiltration, outflow, etc. in both a pristine watershed and as influenced by anthropogenic factors such as storage, pumping, use, discharge, etc.
The Hydrologic Modeling Method (HEC-HMS), by the United States Army Corp of Engineer Hydrologic Engineering Center, is a computer program that simulates the entire hydrologic cycle in dendritic watershed systems. The program can run in either an event-based or continuous mode. The software integrates several hydrological elements in event mode, including event infiltration, unit hydrographs, and hydrologic routing. Continuous simulations incorporate evapotranspiration, snowmelt, and soil moisture accounting. The program has been used to determine flood frequency, forecast floods, design reservoir spillways, and study erosion and sediment transport.
The SWAT (Soil Water Assessment Tool) model is a basin-scale, water-balanced continuous-time model. The model is designed to determine the impacts of management of water, sediments, and agricultural chemicals in large complex watersheds with varying soil, land use, and management conditions over an extended period. It has been extensively used worldwide for hydrologic studies, land use change, water quality, and climate change studies
Hydraulic/Hydrodynamic Modeling:
These tools explore flow in channels and flooding using tools of varying complexity.HEC-RAS models one-dimensional flow, one and two-dimensional unsteady flow, sediment transport, water temperature, and water quality modeling for a complete network of natural and constructed channels. The program has been used to design hydraulic structures for bridge scour analysis, floodplain analysis, dam break, and levee breach analysis, sediment transportation, evaluation of deposition in reservoirs, and water quality.
- Water Quality Models: These models help explore pollution sources for various pollutants and explore the fate and transport of these pollutants and their implications on the water quality of the streams and further downstream receiving bodies of water.
DELWAQ is the engine for the D-Water Quality and D-Ecology programmes, which is part of the DELFT3D suite. The model can solve a wide range of physical, biological, and biochemical processes such as salinity, chloride, suspended sediments, temperature, dissolved oxygen, phytoplankton, algae growth, etc. The main requirement is a hydrodynamic model, which can be coupled with DELFT3D or TELEMAC, both of which are open-source software.
- Limnology Models: These explore the way lakes behave in more detail.
- Erosion Modeling: These use a version of the Universal Soil Loss Equation that models potential erosion based on information such as topography, soils, precipitation, landcover, and land management.
AnnAGNPS (Annualized Agriculture Non-Point Source) model was developed by the USDA Agricultural Research Service and the USDA Natural Resource Conservation Service created the AnnAGNPS (Annualized Agriculture Non-Point Source) model. ANNAGNPS identifies, measures, optimizes, and provides risk analysis for contamination sources located in the watershed. Hydrologic simulations are based on the water balance, and the runoff component is based on the SCS runoff curve number approach. Sediment yield for the surface and stream is calculated using the Revised Universal Soil Loss Equation (RUSLE) and the Hydro Geomorphic Universal Soil Loss Equation (HUSLE), respectively. AnnAGNPS has been used to manage watersheds by simulating soil erosion and the movement of nutrients and pesticides from the land surface to the watershed outlet via the channel.
- Other Specialized Modeling: Watershed modeling can also include very specialized models related to groundwaters/aquifers, energy systems, specialized economic modeling (e.g., game theory), etc.
Modular Flow (MODFLOW) , developed by the United States Geological Survey, is a three-dimensional finite difference groundwater model that is extensively used worldwide. MODFLOW was initially intended solely for groundwater, but the modular nature has allowed for additional capabilities. MODFLOW can simulate coupled surface and groundwater systems, solute transport, aquifer system compaction, and land subsidence, groundwater management, variable-density flow (saltwater), etc.
iMOD is the Deltares version of MODFLOW with a graphical user interface. The program allows grid resolution toggling, editing of subsurface, and scalable which allows for high-resolution groundwater models. iMOD has been applied to density dependent groundwater flow (SEAWAT), water quality (MT3D), and groundwater flow.
- Water Systems Modeling: These usually use either simulation or optimization to look beyond single “projects” such as dams, irrigation command areas, hydropower plants, water supply, etc. and explore these in a larger inter-related systems context (e.g., as a watershed, sub-basin, basin, etc.). Some of these models only bio-physical aspects, but others extend this to include economic, environmental, and social aspects.
RiverWare , developed by the University of Colorado's Center for Advanced Decision Support for Water and Environmental Systems (CADSWES), is a reservoir and river basin modeling tool that enables users to simulate and evaluate various basin operations in both simulation and forecast modes to aid in decision-making. The model employs goal programming and linear programming to optimize each user's set of prioritized policy goals. The program can manage daily and midterm forecasting and long-term planning. RiverWare has been applied to system optimization, water accounting, administration of water rights.
The landscape for modeling is still not very satisfactory with often prohibitive costs of development or customization of tools to model various aspects of watersheds. Current trends for developing more easy-to-use free online tools (some global) give some insight into what is possible in the near future.
There are several modeling tools that are commonly utilized to analyze various aspects of water resources. The more common ones are briefly described below.
Online Analytics
Traditional approaches to water analytics (that are still in vogue today) include a range of often proprietary and expensive desktop modeling tools even to get simple insights into water systems. These often had specific data input formats and inflexible hard-wired interfaces and outputs in terms of tables and visuals.
A new world of online analytics based on increasingly open-source inter-operable standards is changing all this rapidly. There are online platforms that convert static datasets into online data services that can be analyzed using online (and often open-source) scripts using python, R, javascript and other common frameworks to undertake extremely powerful analytics on these online data services. They also interface with a growing range of increasingly free (or low-cost subscription services) for powerful data visualization with highly-interactive maps, graphs, animations, schematics, or other visualizations that can be access on multiple digital devices.
These allow for analytics at a speed unimaginable even a few years ago and help usher in a new age of well-structured open data services and free analytics and visualization that are set to disrupt the world of hydroinformatics.
Cloud Platforms: Google Earth Engine (GEE is a cloud-based platform from Google provides access to multiple repositories of satellite imagery and geospatial datasets allowing quick and accurate analysis and visualization of large datasets available in the cloud, the datasets include free geospatial data, optical and radar satellite imagery, climate information, digital elevation models, land cover maps and a variety of socio-economic variables.
Cloud Modeling: The Hydrologic and Water Quality System (HAWQS) is a version of the popular SWAT (Soil and Water Assessment Tool) model that can be access fully online. It can assist states, local governments, and others to explore watershed climate and development scenarios and with water quality protection decision-making. It provides users with interactive web interfaces and maps; a user’s guide; pre-loaded input data; outputs such as charts, and graphs; and online development, execution, and storage of a user’s modeling projects.
HAWQS Beta Release Introduction, Demonstration, and Q&A
GBDX, by Maxar Technologies, performs geospatial data analytics at scale in the cloud by processing petabytes of information using your custom or their python script. Users work with GBDX imagery in the cloud to obtain insight but do not own the raw data.
ESA Thematic Exploitation Platform (TEP) is a collaborative platform that allows users to extract insights from satellite data without downloading any datasets. TEP has seven main interconnected themes: coastal, forestry, hydrology, geohazards, polar, urban, and food security.
Google MetNet-2 Weather predictions help people arrange their days and manage food production, transportation, and the electrical grid. Current forecasting methods use supercomputers to run physics-based forecasting models. MetNet-2, a deep learning network, approximates large-scale meteorological phenomena by comprehending variations in high- and low-pressure systems that impact precipitation. This method may enhance the frequency, breadth, and accuracy of predictions.
MetNet-2 seeks to reduce the number of processes and complexity needed in developing a probabilistic prediction. The model forecasts 12 hours ahead with a spatial resolution of 1 kilometer and a time resolution of 2 minutes using current satellite and radar images as well as information such as temperature, humidity, and wind direction. This kind of forecast necessitates a high level of spatial resolution. The model is extended 64 kilometers in every direction for every extra hour of projection. As a result, the total input size is 20,482 KM2.
The probabilistic predictions of MetNet-2 average all conceivable future weather conditions multiplied by their likelihood of occurring. The HREF, an ensemble model, used in the United States, is comparable to this approach. A standard ensemble model takes around an hour to develop, whereas MetNet-2 takes less than a second. When comparing the results of the two models, MetNet-2 outperforms HREF for both low and high precipitation amounts as shown by the 0.2” and 2” of rain below over Denver, Colorado, and Hurricane Isaias, respectively.
Improving Forecast with Machine Learning
The accuracy of today's weather forecasts has improved tremendously, with 5-day forecasts as accurate as 1-day forecasts in the 1980s. Instead of deep learning, hybrid numerical machine learning can forecast and speed up weather forecasting. This reduces training time. The Machine Learning model generated 171 distinct 20-day forecasts in under a minute using ECMWF data. Machine learning forecast global weather three days ahead. Comparing the machine learning model's findings to daily climatology, persistence (assumes constant atmospheric state), and the SPEEDY model (low-resolution numeric prediction weather model). The machine learning model can out predict daily climatology, persistence, and the SPEEDY model on a three-day time in the extra tropics (30°-60°), but not in the tropics. So, the Machine Learning model can anticipate well when the humidity is low.
Water Balance
It is incredibly challenging to measure groundwater withdrawals and subsidence from groundwater pumping. Groundwater subsidence can cause damage to infrastructure when measured using GPS data or InSAR. GPS data can have spatial or temporal gaps while processing InSAR data is computationally expensive and must account for atmospheric effects. Groundwater withdrawal is measured either using the GRACE (Gravity Recovery and Climate Experiment) satellite, which measures changes in gravity, a water balance model, or using piezometers. Smith and Majumdar estimated groundwater subsidence in the western United States using a random forest machine learning model. Evapotranspiration, land use, sediment thickness, and agriculture density are proxies to estimate subsidence. The ML model estimated groundwater pumping from 2015–2016 resulted in a 2.0 cubic KM of storage loss.
Detecting Extreme Precipitation
Climate change is warming the atmosphere, which allows for more moisture to be stored in the atmosphere and can affect the timing and location of storms. Stanford researchers have constructed a Machine Language model to investigate long-term trends in extreme weather in the upper Mississippi and eastern Missouri basins as flood events are becoming more common. The model analyzed global circulation imagery from 1981–2019 and identified atmospheric circulation patterns that are connected to extreme precipitation. It predicted 90 percent of extreme precipitation days, which surpassed traditional statistical methods. The trained model determined intense precipitation occurred from atmospheric pressure patterns and atmospheric moisture flux from the Gulf of Mexico. Although originally designed for the US (United States), this approach could be used globally to research weather fronts and tropical cyclones.
Researchers at Rice University have developed a new way to augment an old-fashioned weather forecasting method with the power of Artificial Intelligence, it can predict extreme events a few days ahead and does not require a supercomputer. Historically, climate analysis was done by analog forecasting, which involved comparing existing weather patterns with similar patterns from the past, and today we use numerical weather processing. CapsNet is a type of deep learning that can identify atmospheric circulation patterns in the days preceding an extreme weather event in North America, such as a heatwave or a cold spell, with an accuracy of 80%. Researchers also found that prediction accuracy did not increase when CapsNet was provided with fewer samples. The overall goal is to augment current numerical weather prediction systems.
The figure shown below is an example of a cold-weather prediction using global circulation patterns of 3-days earlier. Only patterns and labels are entered into the model
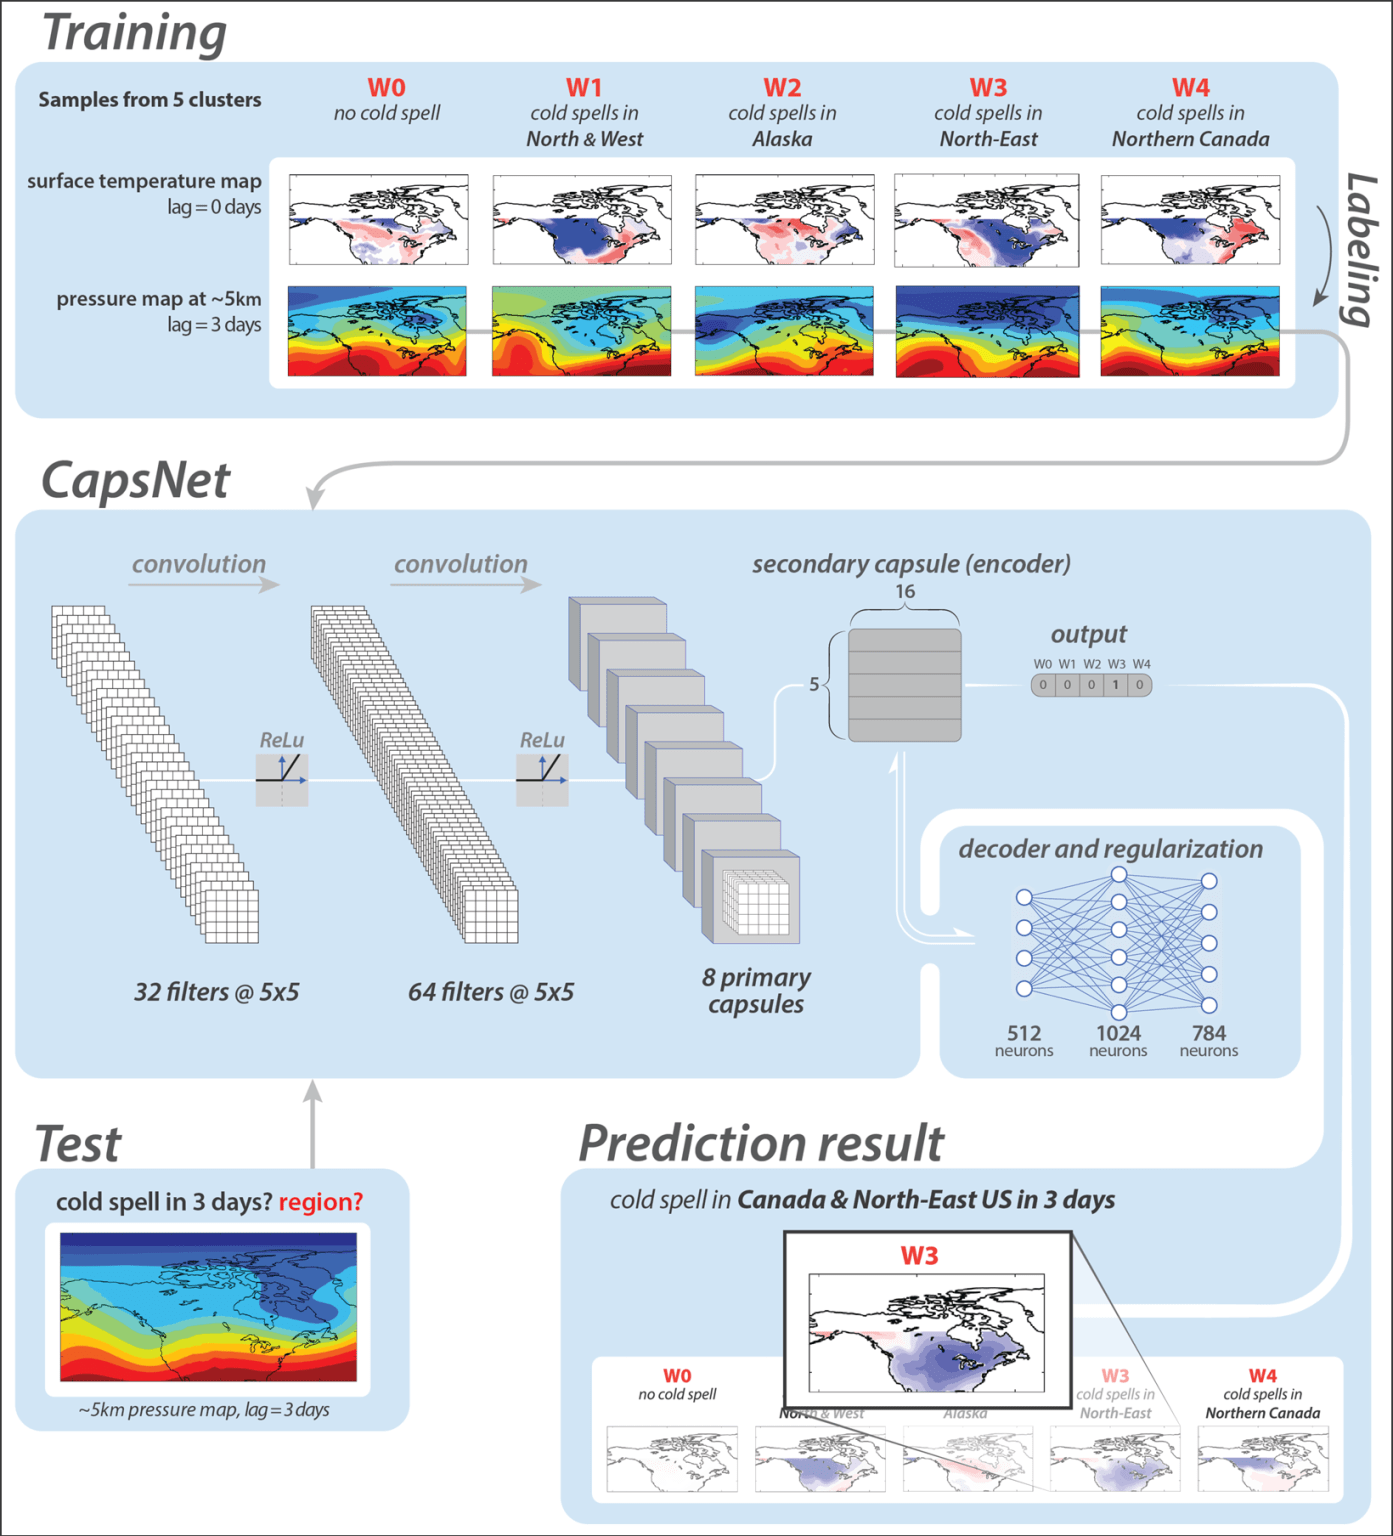
Credit: Chattopadhyay et al., 2020.https://doi.org/10.1029/2019MS001958 CC 4.0
World Flood Mapping Tool aids all countries, especially in the Global South, where data and information gaps are prominent and annual losses due to floods are high. The tool uses the Google Earth Engine combined with Landsat data since 1985 and generates 30-meter resolution flood inundation maps. The free online mapping tool can be used for community planning, building zoning, insurance assessments, including agriculture insurance support, where maps are generated within minutes.
Decision Support
Decision Support Systems (DSS) are integrated approaches to support water resources planning (e.g., watershed investment planning) or real-time systems operations (e.g., cascade of dams, flood management). It is critical to note that these are not decision-making systems but provide information to support decision making where the appropriate stakeholders bring in the value judgements of the synergies and trade-offs involved with various alternative decision paths.
It is useful to explore these from the viewpoint of a data value chain, to go from data to information to knowledge to decision support. It is best to start in reverse order, first outlining the decisions to be supported and then determining the ecosystem of data, analytics, and institutional arrangements required to support that decision.
Integrated Interoperable Frameworks
There is a need to ensure integration of the various parts of data and analytics for users to access, visualize, and interact with the information to support decisions. This requires a great degree of inter-operability amongst these systems. This has implications not only on the kinds of monitoring systems procured (to avoid vendor capture on hardware that is not interoperable with other information), but also to ensure that all the relevant data can be visualized and analyzed using interoperable dashboards or other platforms. The emerging world of online services, especially cloud storage and services, is critical in this regard to tie it all together.
Tangible Landscapes
A tangible Landscape is an open-source tangible interface powered by
GRASS GIS and Blender. It couples a physical model with a digital model of a landscape so that it can be felt naturally, reshaped, and interacted with. It has a real-time feedback cycle of interaction, 3D scanning, point cloud processing, geospatial computation, and projection, in addition to 3D modeling and rendering. Tangible Landscapes can be used for the design and planning applications such as grading, cut and fill analysis, stormwater management, flood control etc.Digital Twins
A digital twin is a virtual representation of an object or system that spans the life cycle of the object or system. It is updated from real-time data and uses simulation, machine learning and reasoning to help decision-making. In the water sector digital twins can be developed for simulation of assets for water, wastewater, stormwater, or river systems using the best available physical models, real-time sensor updates, historical performance, and machine learning/artificial intelligence data.
Digital Twin for Water Management Use case from Bentley
Applications
National and Regional Water Information Systems
There are a range of modern interactive information systems that are being developed around the world at sub-national, national, and regional levels to promote transparent, public-domain access to water-related information fueled by open data policies and leveraging a new world of technology. Some of these are illustrated next and can be excellent to promote a shared understanding of water resources challenges and opportunities and access to archived and even real-time hydroinformatics data from local, national, regional, and global sources.
Modernizing the Data Value Chain
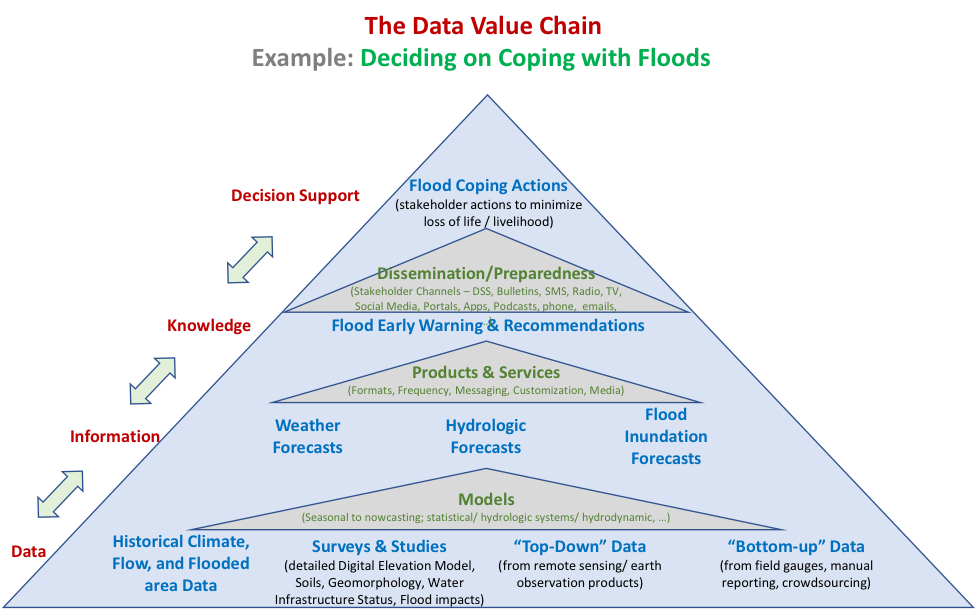
It is often recognized that there is a need for an interconnected data value chain ecosystem going from Data -> Information -> Knowledge -> Decision Support. However, often many start (and get stuck at) the level of data as this could be a never-ending task without the guidance of a decision to support. It is more useful to start at the level of the decision to be supported and then determine the knowledge required to make the decision, the information that would provide the insights from the data to provide this knowledge, and the analytical and stakeholder processes that would be required in this context. This data value chain pyramid (as illustrated here for decisions on flood coping) is useful in outlining the ecosystem of interrelated inputs required to help make that decision.
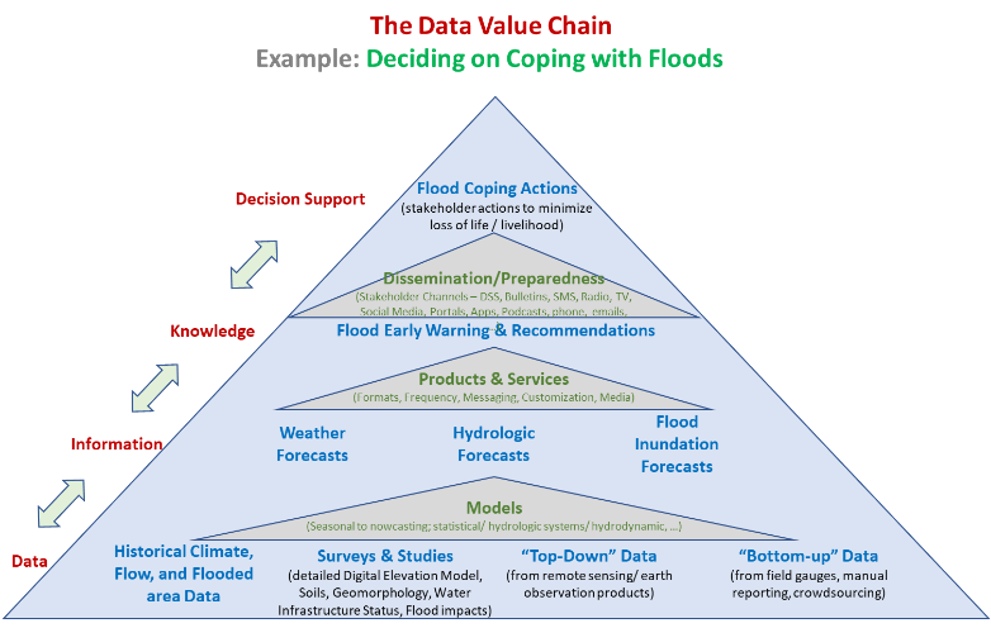
There will be different data value chains for different decisions (e.g., prioritizing and targeting planned water investments or coordinating operations of water infrastructure in a system) but they could draw upon the same or similar data, information, analytics, or knowledge processes and institutions. This makes it even more important to ensure that a curated set of consistent historical and real-time data is available in required formats at any time for these different users and their decisions.
Elements of Modernizing the HydroInformatics Data Value Chain
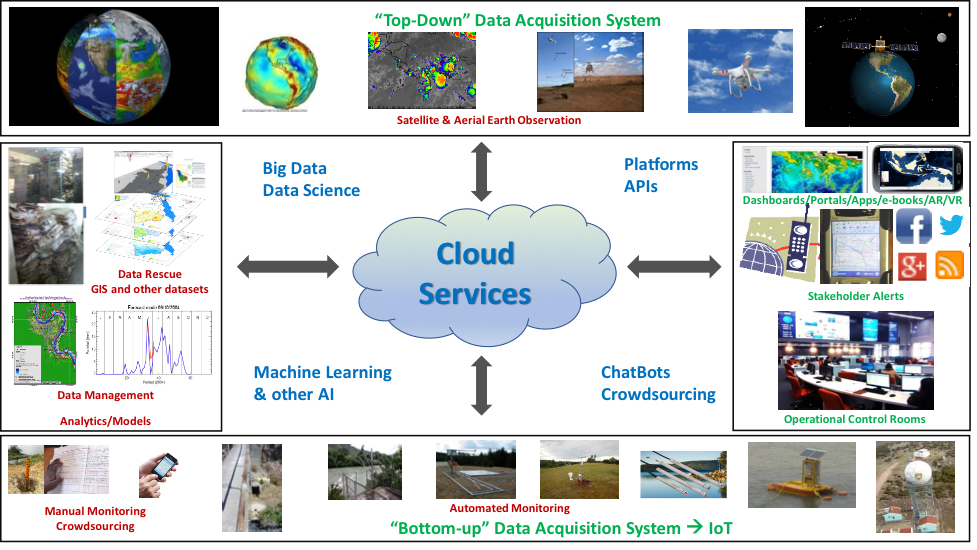
There are good opportunities for leveraging new technologies for all aspects of the data value chain:
o Collecting Data (Earth Observation incl. Satellites, Aerial/Drones; Heliborne geophysical surveys, In-situ sensors, Citizen Science and Data Rescue)
o Analyzing Data (Geospatial/Big Data, DSS, Cloud Analytics, and evolving AI/ML systems) – more global systems e.g., GEOGLoWS Streamflow estimation, leveraging in-situ data for calibrating/training global estimates
o Accessing and Visualizing Data (e.g., visualization script libraries such as d3js, dashboards on different platforms such as operational control rooms, computers/touchscreens/tablets/ smartphones/AR/VR); Other outreach (e-books, hackathons, data jams) using data and analytical services with appropriate “middleware” to automate tasks
o Supporting Decisions (e.g., supporting various planning and real-time operational decisions including basin planning, coordinated water infrastructure operations, early alert systems, investment planning, climate insurance implementation, etc.)
Country Example: Real Time Decision Support Systems (RT-DSSs) in India
As part of the World Bank supported Hydrology Project Phase II , Real Time Decisions Support Systems (RT-DSSs) were developed and implemented for the Bhakra-Beas Basin and for the Krishna and Bhima Basins. A Real time Data Acquisition System (RTDAS) consisting of a telemetry network of rainfall & snow in the catchments and water levels along rivers, reservoirs and canals was installed to provide inputs to the RT-DSSs. The RTDAS provides key data required for forecasting Inflows into the reservoirs and forms the basis for reservoir operation decision making and providing flood early warnings to communities. The RT-DSSs are based on modelling systems supported by hydrological, hydrodynamic and water accounting modules (source: BBMB Project Information Sheet ). Additional information can be found at the Hydrology Project RT-DSS webpage .
Regional Example: Operational tools in the Nile Basin
Operational tools have been developed for the Nile Basin as part of the World Bank supported projects. The Nile Basin Decision Support System (DSS) is a computer-based planning support platform with a suite of modeling and information management tools for communication, information management and analysis of water resources. This DSS was initially developed as part of the World Bank supported SVP: Water Resources Planning & Management project, Phase I and Phase II .
Under the Eastern Nile Planning Model (ENPM) World Bank supported project, the Eastern Nile Technical Regional Office (ENTRO) developed, customized and/or used a range of hydrologic, hydraulic, watershed, and optimization models to analyze investments and management options in the Easter Nile region. This included the initial activities for the development of a Flood Forecast and Early Warning System (FFEWS), which is being scaled-up across the Nile Basin under subsequent projects. ( more info ). Additionally, the following models were developed. A water balance model was developed (using SWAT) and used to analyze several development and climate change scenarios in the Eastern Nile Basin ( more info ). A Multi-Purpose Optimization System was developed for the Eastern Nile using GAMS optimization software linked to an Excel Interface GAMS ( more info ). A water Simulation Model was developed (using RIBASIM) for the Eastern Nile and used to simulate different water infrastructure development and climate change scenarios ( more info ). A Planning model was developed (using RiverWare) and used to simulate different infrastructure development projects ( more info ). A HEC-ResSim model was developed and used to explore the impacts of building water infrastructure on the Eastern Nile River basin. ( more info ).
A new generation of tools are being developed under a Nile Basin Data and Analysis Services (NB-DAS) framework leveraging open online services and modern interactive dashboard visualization. The HydroMet network is also being enhanced to include more real-time data on weather, water levels and discharge and water quality.
Global Systems for Flood Data
There are a number of evolving global systems for helping visualize and access flood-related data. A few of these are presented here for illustration. Some of these just provide visualizations of the data and others provide advanced open APIs to access the data. These are expected to grow dramatically in the future leveraging improvements in earth observation, open access data, cloud analytics, and machine learning/AI.