There are a range of new online services fueled by modern cloud analytics that are revolutionizing data access and visualization of complex hydroinformatics data.
Open Data Formats
There has been an explosion of free open data services on various aspects of water, most of them based on earth observation and global models and providing synoptic global coverage.
The Open Geospatial Consortium (OGC) supports ways to create free, public, open geospatial standards to promote interoperability. OGC standards are developed to make location information and services FAIR – Findable, Accessible, Interoperable and Reusable. They are used by software developers to build open interfaces and encoding into their products and services. The following are some of the standards:
- The OpenGIS® Web Map Service (WMS) Interface Standard provides a simple HTTP interface for requesting geo-registered map images from one or more distributed geospatial databases. A WMS request defines the geographic layer(s) and area of interest to be processed. The response to the request is one or more geo-registered map images (returned as JPEG, PNG, etc.) that can be displayed in a browser application ( Open Geospatial Consortium (OGC) standards ).
- The Web Map Tile Service (WMTS) Implementation Standard provides a standard based solution to serve digital maps using predefined image tiles. The service advertises the tiles it has available through a standardized declaration in the ServiceMetadata document common to all OGC web services ( Open Geospatial Consortium (OGC) standards ).
- The Web Feature Service (WFS) represents a change in the way geographic information is created, modified, and exchanged on the Internet. Rather than sharing geographic information at the file level using File Transfer Protocol (FTP), for example, the WFS offers direct fine-grained access to geographic information at the feature and feature property level.
- WaterML is a standard information model for the representation of water observations data, with the intent of allowing the exchange of such data sets across information systems. There is also a GroundwaterML standard that is being explored for groundwater as part of this work.
Open APIs
Open APIs are publicly available application programming interfaces which provide developers with programmatic access to a proprietary software application or web service. They allow developers to access backend data that can then be used to enhance their own applications. APIs such as the Floodizer flood detection API , a cross browsers REST API which gets a JSON input with a still photo (as base64 encoded string), containing flooded areas and returns a JSON string which contains predictions of the input photo regarding the probability of a flood.
The Rainviewer API: provides access to mapping data of rainfall based on information from weather radars globally.
Below are some examples of available online services.
Spatial Agent Data Primer
Countries are making use of free open-source data online to improve access to historical and current data for analysis of trends and decision support of their water resources and utilities
Malawi Spatial Data Platform (MASDAP) , is a web-based data sharing tool launched in November 2012, managed by the National Spatial Data Center in the Department of Surveys, in collaboration with the National Statistics Office and other technical Ministries. This portal is free and based on open source GeoNode software for improved inter-agency collaboration and enhanced public access to information for knowledge product generation and decision support. It allows users to upload, manage and browse spatial data, explore, compose, and share maps, search and download relevant documents, and gives various levels of access to users (viewing, editing, uploading) based on nature of their work and needs. It hosts a variety of Environment, Water Resources, Forestry, Climate, Agriculture, Disaster Risk related datasets at varying scales for Malawi. Water resource datasets include Rivers and glaciers, salt lakes, water utilization plans, dams, currents, floods, water quality, hydrographic charts, tides, tidal waves, coastal information, and reefs.
Online services are also enabling the cooperative management of transboundary water resources among countries, where previously access to comprehensive data was challenging
Transboundary Waters Assessment Programme: The groundwater component of the Transboundary Waters Assessment Programme (TWAP) provides aggregated information for the main transboundary aquifers and Small Island Developing States (SIDS). The data that has been made available in the TWAP Groundwater Information System(link is external) includes core indicators, encompassing the hydrogeological, environmental, socio-economic and governance dimensions of the systems.
Scripts
There are new paradigms evolving to reusing code so that people can better leverage each others’ work and not re-invent the wheel. This includes the development of scripts or pieces of code that are well-documented and open-source to promote their reuse and continuous development. There are tutorials or guided instructions to discover and visualize new data or information in Python or R scripts stored on GitHub , GitLab , or BitBucket such as NASA or Planet. In addition, some journals such as Nature require the code to be posted to demonstrate reproducibility. The posted code allows other researchers or scientists to build upon the original author's work. These scripts have become excellent enablers of a new generation of open-source ecosystem. These are also the case on free systems that may not be fully open-sources such as Google Earth Engine with has reusable code repositories and communities of practice.
Visualization: There are a range of new opportunities to leverage modern technology to interactively visualize data of any type – and the spatial and temporal data that is common in hydroinformatics is no exception.
There are many tools that we can use to create interactive online dashboards using a range of free and commercial tools (note that even commercial tools usually have free versions for smaller datasets). These allow us to create and publish interactive maps, charts, animations for use in dashboards or interactive e-documentation.
Flourish is an interactive data visualization product that allows for creating interactive charts, maps, and animation from spreadsheets without requiring any coding or specialized software. The product is used in story maps to display up-to-date information.
DataWrapper allows one to create interactive and responsive data visualizations including charts, maps, and tables.
Online Portals
Interactive E-books/Story Maps: It is possible today to create more interactive e-packaging of materials to dramatically change the user experience from reading hardcopy or static digital documents. This Hydroinformatics e-book is an example of e-packaging into an interactive document where the user can access a world of knowledge generated from multiple institutions using the evolving interoperability of systems that allows us to embed accessible videos and other multi-media as well as interactive charts, maps, and other datasets into a narrative. It would be useful for most documents and reports (e.g., State of Environment Reports, Stakeholder Assessments, Basin/Watershed Profiles) to become more interactive in the future to allow users to interact and go deeper into any topic as well as benefit from central updating and being able to quickly access the e-packaged resource from any device (e.g., smartphone, tablet, computer).
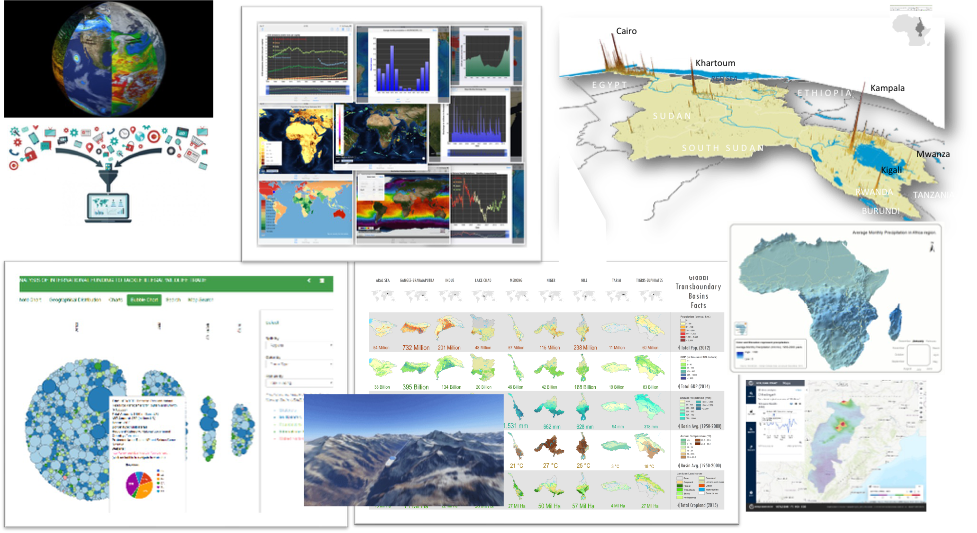
Data & Analytics Dashboards: A special form of e-packaging is to be able to access, analyze, and visualize complex data in a highly interactive manner through customized dashboards. For example, as a companion to this eBook, we have created a HydroInformatics Data & Analytics Catalog to help visualize some examples of a growing world of free, public-domain data and analytic services mostly covering the whole world.
These can include tools to do online analytics that leverage interoperability based on common data standards, open-source approaches, and open data and scripts. For example, in the interactive map below, you can zoom into any area you like (even globally), change background maps that give you scale-dependent services from different institutions using interoperable standards, and if you click on any point (e.g. on a river), it will outline the corresponding watershed (using an ESRI script using the STRM global elevation data that was collected on a space shuttle mission a couple of decades ago) and showing this on an open-source environment (leaflet in this case).
World Bank Water Data
World Bank Water Data is an online source for all water-related open data at the World Bank, where there are datasets and applications generated or compiled by the Water Global Practice with the support of the Global Water Security & Sanitation Partnership (GWSP). The datasets curated from world bank open data catalog, initiatives such as SIASAR and IBNET, in addition to external data sources.
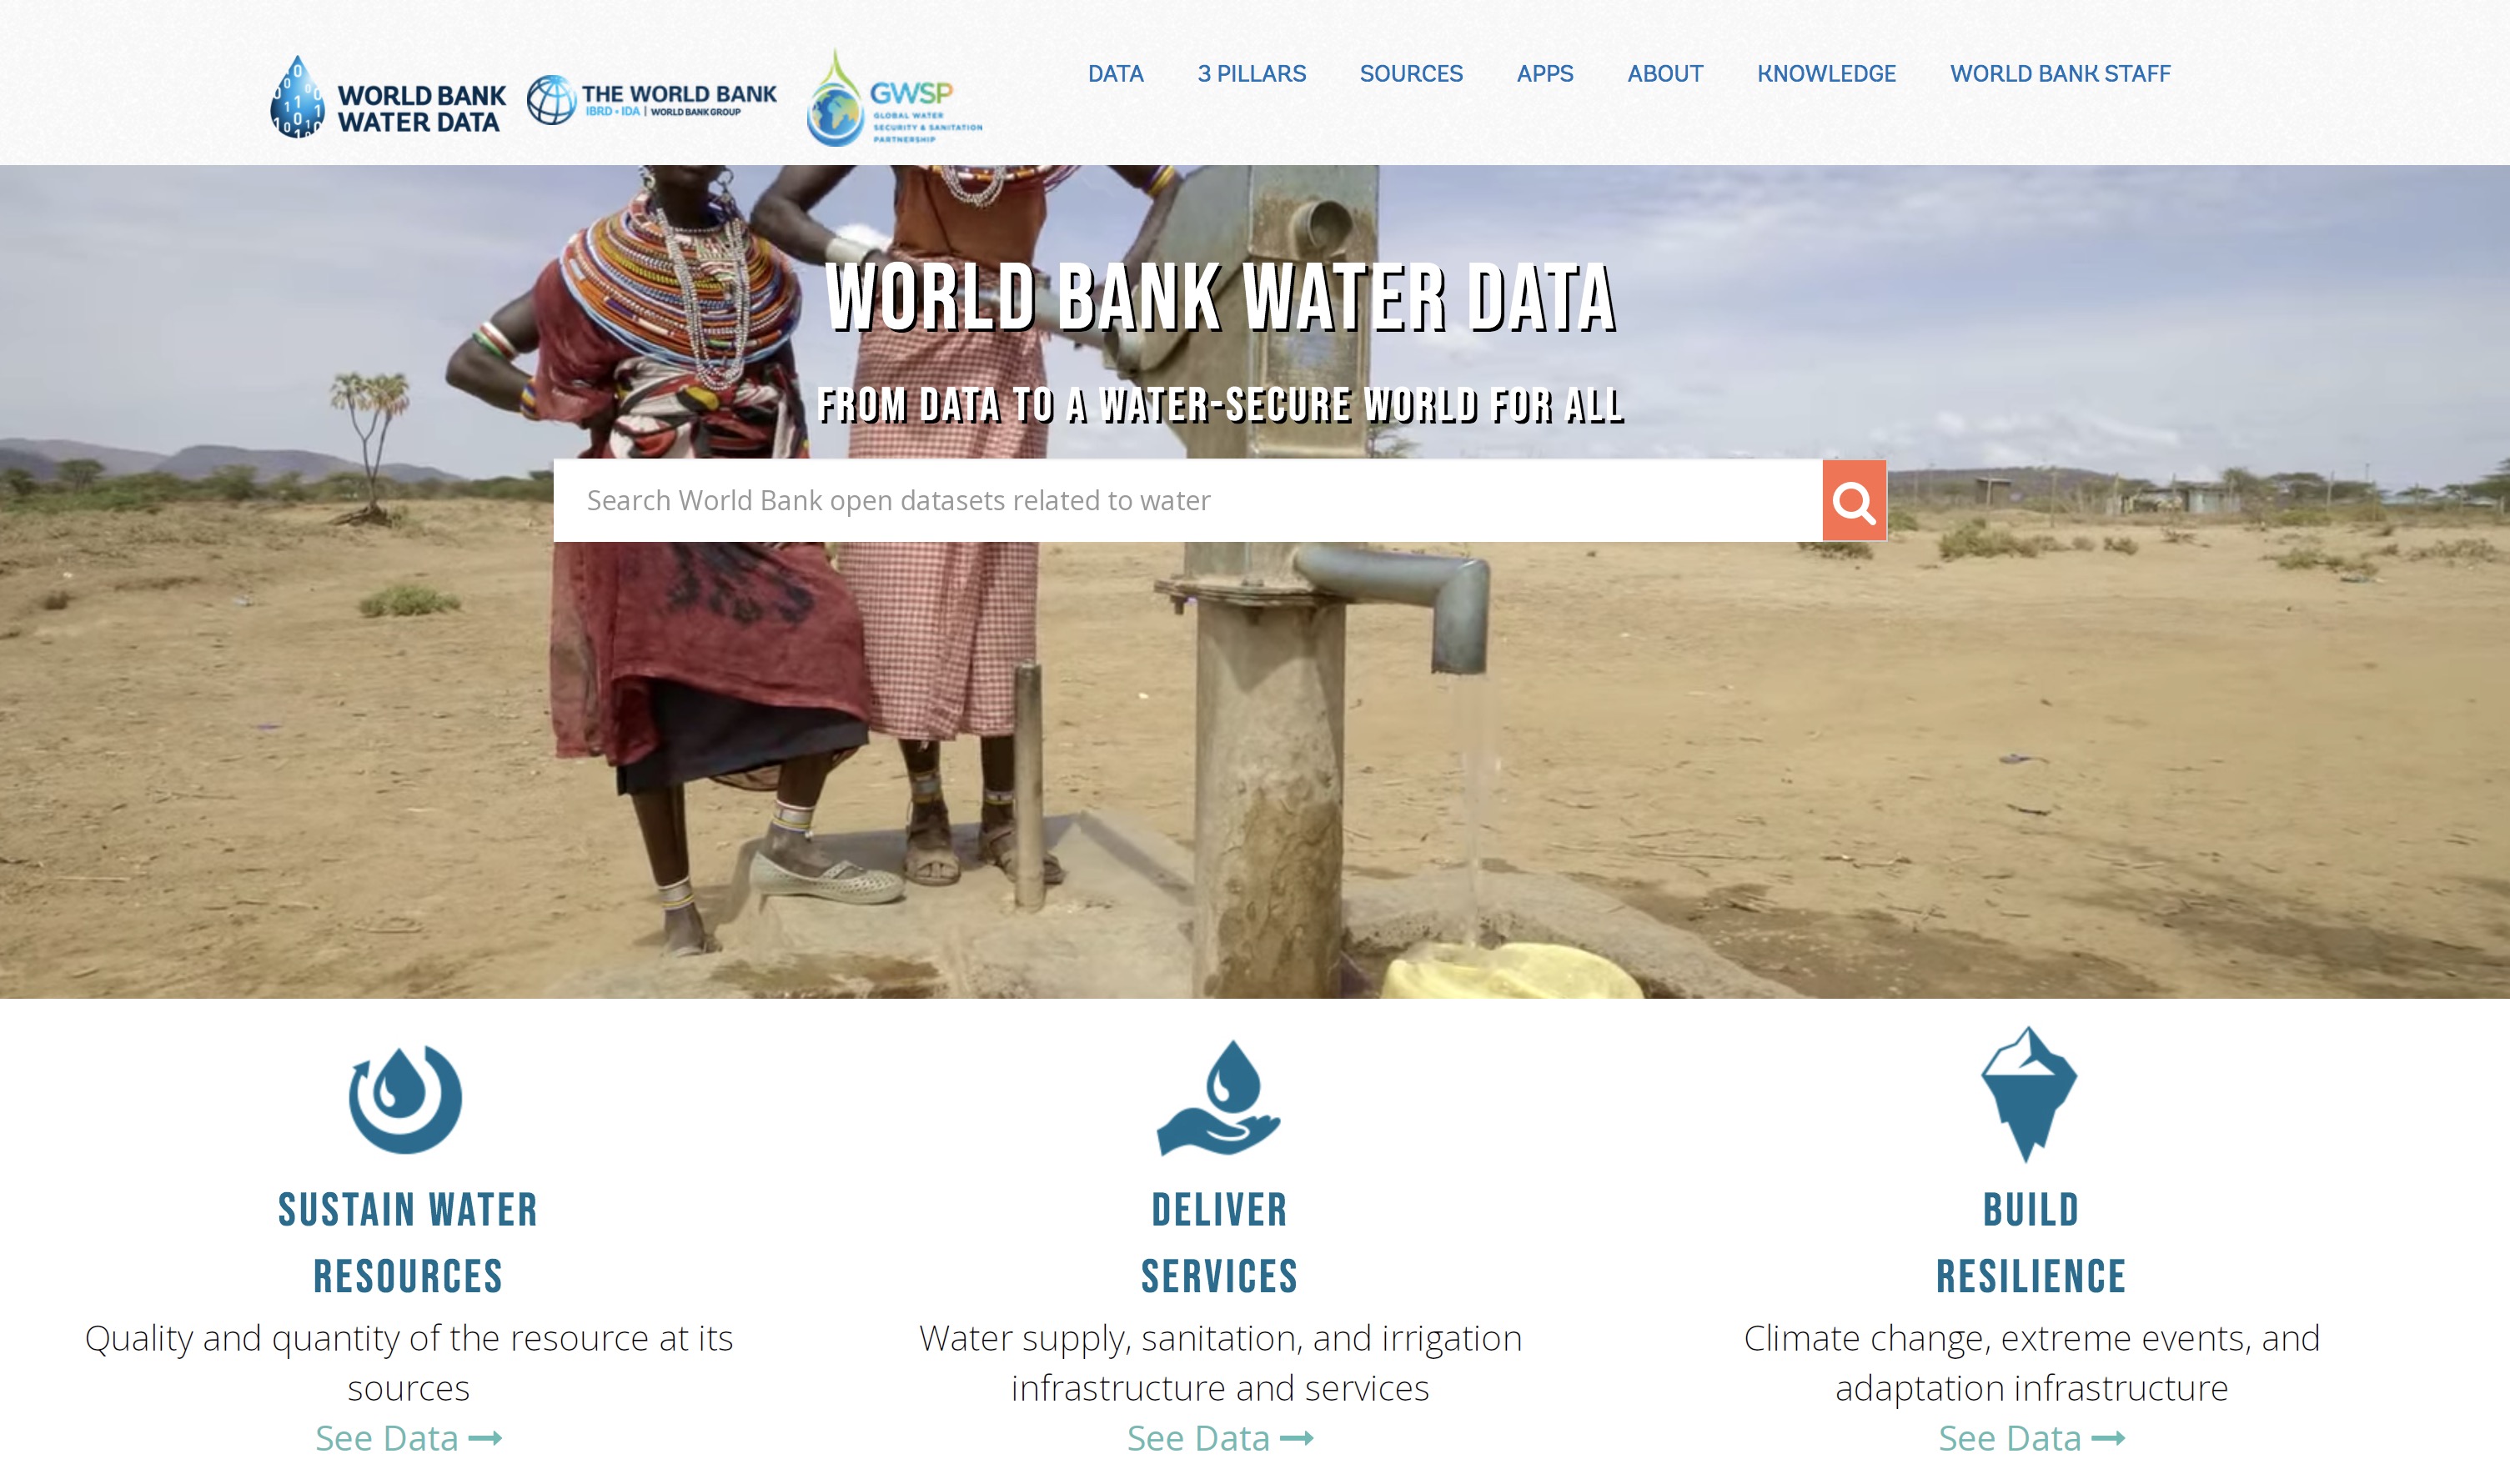
The APPS featured on the portal include:
Evolving Concepts
Virtual Reality (VR)
Virtual Reality (VR) technologies are a rapidly-evolving technology increasingly being used in projects across sectors, enabling virtual tours and training all around the world. By providing effective and efficient visualization of the real world such as the data relevant to Integrated Water Resources and Watershed Management, VR has become an innovative way of communicating with stakeholders. It provides water engineers, infrastructure managers, policymakers, development practitioners, and anyone to experience the real world and identify challenges virtually. Applications could range from interactive 360o videos to more complex immersive visualization of data or training material. They could help individuals in different locations to interact virtually while exploring some 3D information. Imagine if you could spin a globe to explore historical or near real-time water cycle information in any part of the world, or work with global experts to study a dam or a flooded area, or make this part of a “digital twin” of a water infrastructure asset. To illustrate a simple aspect of VR, check out these increasingly popular sample 360° VR virtual tour (you can see these even without a VR headset by dragging your finger across the screen to view a different part of the landscape or view while the video is playing or click on options provided):
Augmented Reality (AR)
Through data visualization, water utilities increase efficiency in operational management, stakeholder consultations and strategic decision-making. Data visualization allows complex and extensive data stream to be translated effectively. Augmented Reality (AR) enables the digital projection of information on to the real world. It can take people inside the field and identify issues and mechanisms. These have become popular by apps that help you leverage a smartphone camera to view imaginary creatures or objects in a room. These can also be used to project hydroinformatics information onto schematics or actual systems or help visualize a watershed or a LiDAR survey in your room.