Aquagenx CBT EC+TC is a rapid onsite water quality testing kit by changing color that can check for the presence or Most Probable Number (MPN) for E. coli and Total Coliforms without the use of lab equipment.
The Idexx Quanti-Tray 2000 is a rapid, easy-to-use method to quantify coliform E. coli and enterococci using the most probable number (MPN) in water or wastewater. Sample water is mixed with reagent and then poured into the tray. The tray is sealed and incubated for 24 hours, where yellow and positive fluorescent wells of each size are counted and compared to statistical charts. Statistical charts convert the total number of positive samples and wells into an MPN value.
m-ColiBlue24 detects and identifies E. Coli and total coliform within 24 hours without the requirements for a confirmation stage or the use of fluorescent lamps. E. coli colonies appear blue, and other coliforms appear red in the findings, making visual understanding easy.
HACH handheld colorimeter DR900 allows for 90 different water quality tests in the field with the ability to transfer the data via a USB cable. Testing is performed by adding a reagent to an ampule and then inserting the ampule into the cell holder, and the results are determined by subtracting a background value. The type of water quality tests that can be performed include dissolved oxygen, chlorine, iron, nitrates, fluoride, organic carbon, phosphates, etc.
Online Surveys
There are many field apps using smartphones to collect geo-enabled data/multi-media (e.g. built on Open Data Kits or ODKs or proprietary services – e.g. KoboToolBox). Now, there are also versions that be done for online surveys, even with spatial content (e.g. working with experts to identify infrastructure rehab needs or with communities to outline extent of flooding or indicate potential areas to be monitored or visualization needs for a complex water system). These can be built using free, bundled, or subscription approaches (e.g. with KoboToolBox, ESRI Survey123 , etc.) to help collect data, convert them to services, and the visualize them through easy to create interactive dashboards to obtain insights. They could become part of the arsenal of a modern broad hydroinformatics system.
Crowdsourcing
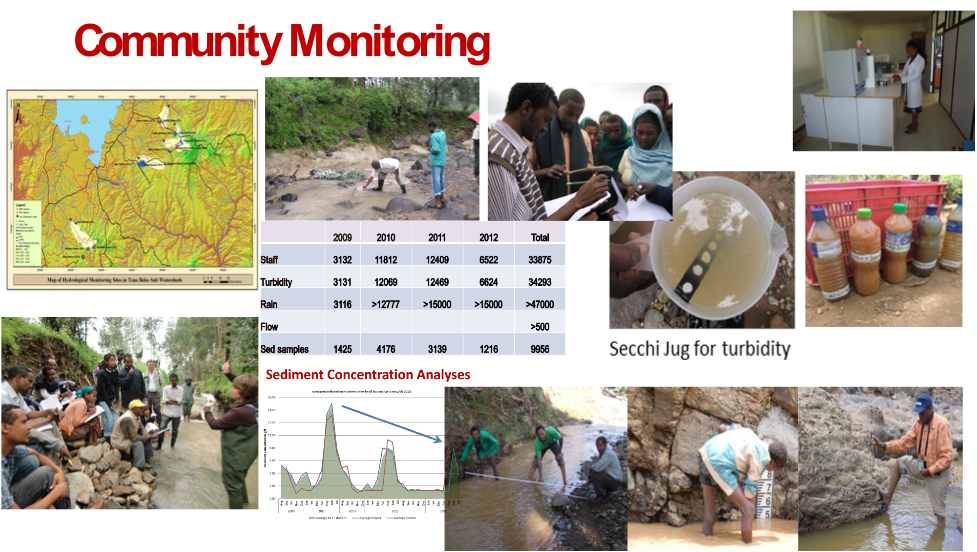
There are a range of more digital methods that are starting to replace traditional log registers leveraging increasingly ubiquitous smartphone access (or SMS-based systems for legacy access). This facilitates better data entry and provides a platform for structured and unstructured crowdsourcing of data from targeted users and community monitoring and citizen report cards . These will become more prevalent as connectivity and mobile data access improves and, in a few years, 5G could also revolutionize edge computing and access speeds further.
The LOCSS (Lake Observation Citizen Science and Satellite) project aims to better understand lake dynamics by combining the efforts of citizen scientists with satellites. At 70 places worldwide, citizen scientists report lake height by reading lake gauge heights and then sending the data via text message or email. These results are combined with lake surface area data generated from satellite pictures. As a result, researchers can investigate how the volume of water in a particular lake fluctuates over time and assist in understanding how water travels in connection to these lakes and their surrounding terrain.
MyWell is a smartphone and SMS app for collecting and analyzing data related to depths to well water level, rainfall amounts, checkdam water levels and water quality parameters. The crowd sourcing app engages farmers, schools, and local communities, displays the status of the groundwater level in addition to the above parameters, with historical values for comparison and analysis.
TamilNadu water quality kit was developed to promote community participation and create awareness in schools. The kit uses reagents to test 12 water quality parameters, which include ph, hardness nitrate, phosphate, chloride, bacteriological examination, etc.
Extreme climatic events such as floods, droughts, and increasing sea levels make Indonesia susceptible to disasters. However , on the other hand, Indonesia has one of the greatest concentrations of Twitter users, where people post information on the weather, traffic jams, and school closings. PetaBencana is an open-source disaster platform that uses social media data to track disasters in real-time. Users are then sent to a website to identify a disaster on a map, geotag photographs, and submit a disaster report using a chatbot. The gathered social media data and official data are utilized to create a disaster map that makes vital information instantly available to everyone. The site can run on the most basic phones and poor data connectivity to increase overall accessibility.
PetaBencana uses a chatbot to encourage active user engagement in data verification and structure to cut costs and gain scale. The platform's success has been since the developers first learned how Indonesians convey information on social media. This technique is being applied abroad, but it does require an understanding of culturally sensitive behavior and risk perception so that the chatbot can be tailored to a new location, including an appropriate tone. There have been chatbot initiatives in other parts of the world, such as the Philippines.
Water Drones
There are a new generation of drones that are being deployed on and under water that bring a completely new dimension to hydroinformatics. For example, floating drones or sensors attached to floating craft or a Unmanned Underwater Vehicles (UUVs), some of which can be autonomous or tethered, can be used to survey temperature, bathymetry, water quality, plastics, dam safety, and even support fish assessments.
Top-Down (Earth Observation)
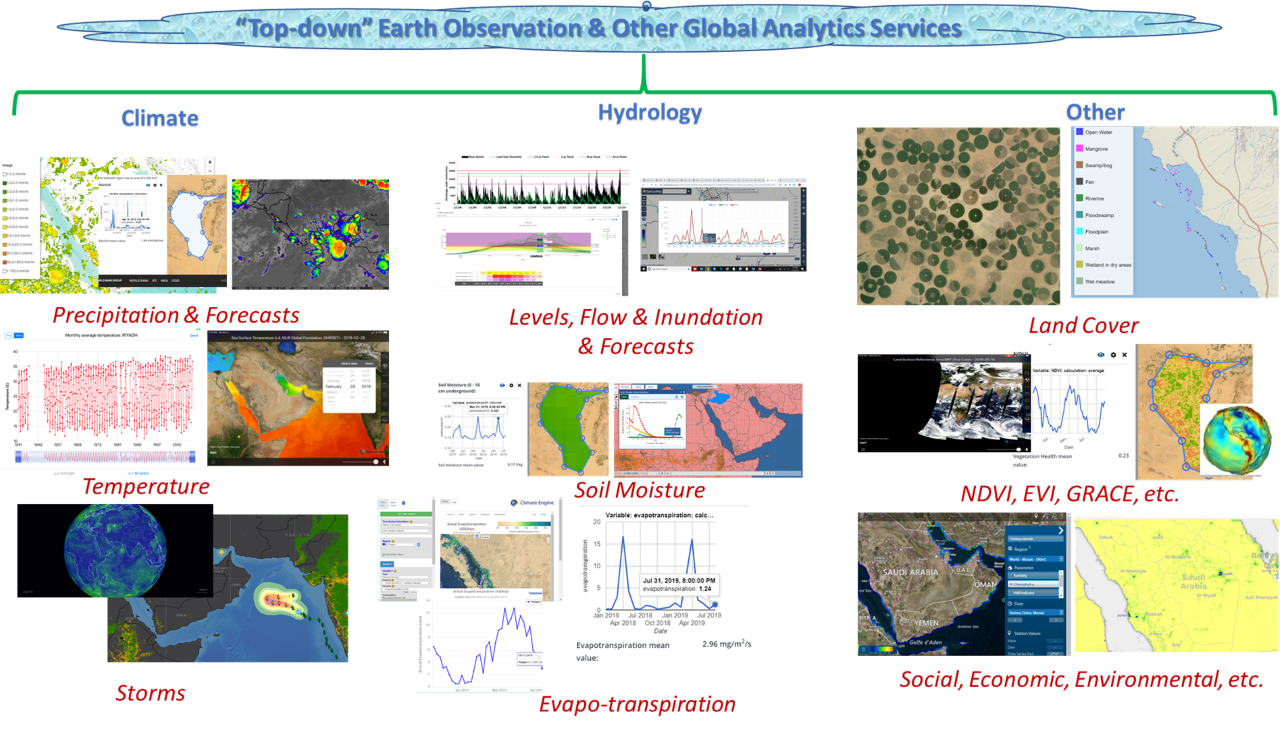
A whole new generation of new “eyes in the sky” has resulted in a range of new free (e.g., from NASA , ESA ) and subscription global services for earth observation that are not just using the visible spectrum but other wavelengths that can be used to see through clouds, determine vegetation health, estimate rainfall, evapotranspiration, and many other parameters that can be useful for water management.
Satellite Earth Observation
See an overview of how Earth Observation can be used in Water Resources Management. See an interactive e-book (Developed by NASA and the World Bank) summarizing some of the common water-related earth observation data services and additional discussion of options from the European Space Agency .
Climate Hazards Group InfraRed Precipitation with Station data (CHIRPS) is a quasi-global daily or pentad rainfall with 40-years of record starting from 1981- to the near present. CHIRPS blends satellite rainfall imagery with station data. A monthly video from 1981-2016 of Africa is shown in the video below.
NASA's Integrated Multi-Satellite Retrievals for Surface Precipitation, (IMERG) , provides most of the world's surface precipitation data. IMERG incorporates historical Tropical Rainfall Measurement Mission estimates from 2000 along with Global Precipitation Measurement. Multiple satellites allow for the development of half-hourly rainfall estimates at a 0.1° horizontal resolution.
Sentinel-1 is the first satellite in the European Space Agency's and the European Commission's Copernicus satellite constellation. The mission is made up of two satellites, Sentinel-1A and Sentinel-1B, that orbit in the same orbital plane. Sentinel-1 is equipped with a C-band Synthetic Imaging Radar (SAR) capable of imaging down to 5 meters and covering an area of up to 400 kilometers. SAR satellites are not affected by cloud cover or lack of illumination and can collect data over a day or night, under all weather conditions. It is planned to acquire high-resolution images of all global landmasses, coastal areas, and shipping channels, as well as vignettes of the global ocean.
The European Space Agency operates Sentinel-2 as part of the ESA Copernicus constellation. Twin optical high-resolution multispectral satellites flying in the same orbit but phased 180° apart are planned to have a 5-day revisit frequency at the Equator. Sentinel-2 carries an optical instrument payload that samples 13 bands where the spatial resolution ranges from 10 meters to 60 meters. Sentinel-2’s provides continuity of SPOT and Landsat-type image data by contributing to ongoing multispectral observations and are used for various purposes, including land management, agriculture and forestry, disaster monitoring, humanitarian relief operations, risk mapping, and security concerns.
Landsat 8 , launched in 2013, is the eighth satellite designed to continue the program of global space imagery acquisition that the United States has been implementing since 1972 with the help of the Landsat series. The multispectral satellite samples imagery in 11 bands: the visible, near-infrared, shortwave infrared, thermal and panchromatic band. The improved thermal band would improve the study of heat and moisture transfer in the agriculture and water management sector.
Earth Map is a collaboration of Google and FAO , it is a free, easy-to-use tool that accesses and analyses geospatial data. Earth map provides unprecedented access for visualizing and interacting with earth observation datasets and overcomes big data limitations for use in real-time monitoring and quick historical analyses.
Subscription Services: There is an increasing trend for private sector firms offering data from private sources (e.g., high-resolution satellite images) or analytics from proprietary algorithms on free data (e.g., using machine learning) as paid subscription services for users. This Data as a Service approach will become more popular to leverage cloud service and interoperability to allow users to mix a combination of free and such subscription services for their use in visualization or further analytics to obtain insights for decision support. These currently exist for a range of earth observation (e.g.Maxar,Airbus, Earth-i), climate, weather (e.g. Tomorrow, aWhere Planet Watchers), and water related services, and these will invariably grow rapidly in the future.
There are many publications that provide summaries of earth observation from a water perspective. A couple of these include an interactive e-book on Earth Observations for Water Resources developed with NASA by the Bank team.
In the area of irrigation Irriwatch provides detailed soil water potential and soil moisture data in the root zone using satellite remote sensing technology along with an estimate of actual crop evapotranspiration and crop production
Aerial Surveys
Over the last few years, researchers and development agencies have been using drones/planes to conduct aerial surveys and Heli-borne geophysical surveys of water resources that support vital ecosystems.
HeliBorne Geophysical Surveys: These surveys that used to be popular for oil exploration are increasingly being used for groundwater insights. One version (e.g., fromSkyTem) involves a large sensor ring suspended by a helicopter to provide insights to the geophysical structure 600m below the surface. These technologies can revolutionize the speed of collecting data over specific areas and the use of this information both for visualizing the invisible but also help with groundwater modeling.
Virtual Planet is a company that explores climate impacts through visualization based on hyper realistic models. They have leveraged the capabilities of drones, 3D mapping and virtual reality technology to recreate different coastal and inland hazards and help communities to learn about potential challenges and to adapt to a new climate. They use drones to get photos and specific information about the area that they are going to study. Then they combine that information with local elevation data, flood information and sea level rise projections to make site-specific renderings for what each place should expect to see with rising seas.
Eyes in the Sky, Pollution in the Water
Earth observation from satellites and Drones/UAVs are a novel approach to monitor water quality from space for some parameter (e.g., chlorophyll indicating algal blooms, sediment, cyanobacteria, etc.). For example, GEO AquaWatch is an initiative of the Group on Earth Observations (GEO) to build global capacity and utility of earth observation derived water quality data, products, and information to support water resources management and decision making. Many of these approaches leverage the rapid growth in availability of satellite information in the public domain and analytical tools such as Google Earth Engine. There also appears to be significant potential to use machine learning and other AI approaches to help fill gaps and estimate other water quality parameters to support decisions. A major challenge remains access to even basic consistent data services on water quality across the world.
Aerial Drones
Unmanned Aerial Vehicles (UAVs) or drones are becoming increasingly used as a part of the hydroinformatics toolkit. This includes use for just aerial video surveys, normal optical RGB sensor information (that can also be used to generate elevation information), and special sensors (e.g., LiDAR, multispectral, microwave, thermal, hyperspectral) to get additional insights. These are increasingly using cloud analytics (e.g. Pix4D, SiteScan ) to be able to do powerful online analytics and insights (see example ) using drone inputs to generate useful products for water resources planning and management (e.g., digital elevation models or digital terrain models to aid flood vulnerability assessments, land cover/NDVI or evapotranspiration analytics, etc.).