Landslide Risk Assessment Steps:
 Hazard
Identification
Hazard
Identification
 Hazard
Assessment
Hazard
Assessment
 Exposure
Assessment
Exposure
Assessment
 Vulnerability
Assessment
Vulnerability
Assessment
 Risk
Risk
Assessment
Description:
Review of literature and past landslides (landslide inventory) in order to characterize landslide hazard in the project area
Purpose:
To characterize landslide hazard within the project area.
Activity:
Expert consultations, review of literature and past landslides (landslide inventory) in order to characterize landslide hazard in the project area.
Questions Answered:
What types of landslides are most common in my project area (landslide typology: movement, material, velocity) and where have they occurred?
Data & Analytical Options:
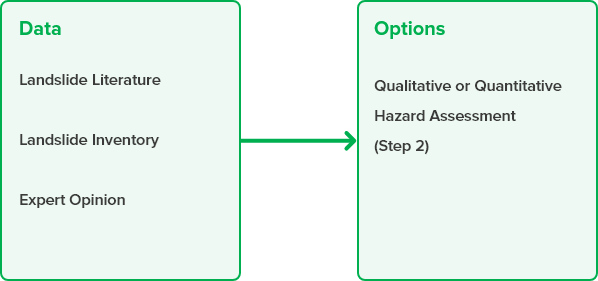
Landslide inventory data can characterize landslide hazard in an area. Landslide inventory data are useful in characterizing the landslide hazard in a particular area, both in terms of spatial location and type and extent of mass movement. Inventory data can help project teams to understand how frequently landslides have occurred in a project area, the spatial location of the initial slides and runout, and what the causative factors may have been. Inventory data also allows the project team to select the appropriate hazard (susceptibility + trigger) model for Step 2. For example, inventory data is required in order to conduct heuristic and statistical LRA models at various scales. Landslide inventory data can be a limiting factor in LRA because it is often difficult to obtain (e.g. landslide inventories are lacking for certain regions), particularly in the developing country context, and building capacity in this regard could be an indirect and longer-term goal of LRAs. The data assessed in Step 1 can determine the components of Step 2 (hazard – susceptibility and trigger) that are quantitative and which elements must be qualitative.
Illustrative Example: Sierra Leone
The Sierra Leone Multi-City Risk and Hazard Assessment identified rainfall as the main landslide trigger through experience (it was the trigger for the 2017 Regent Landslide ) and human activity in part through a literature review (Thomas 1998).
Where local inventory data is lacking, global sources of data can be helpful. NASA has developed a Global Landslide Catalog (GLC) using various open access, global data sources. The GLC is supplemented by the Cooperative Open Online Landslide Repository (COOLR) , which uses citizen science to report additional landslide data to the Catalog. A review of the COOLR project and initial results are available in Juang et al 2019 .
Landslide hazard assessment combines the susceptibility to landslides with the probability of a triggering event, such as precipitation.
Description:
Landslide hazard areas identified and classified through susceptibility and trigger factor analysis using various methodologies.
Purpose:
Landslide hazard areas identified and classified through susceptibility and trigger factor analysis using various methodologies.
Activity:
Landslide susceptibility and triggering factors are assessed in a geospatial environment, where the area is represented as a set of cells that have different parameters.
Questions Answered:
Where might landslides occur in the future: which areas in my project area are more susceptible to landslide hazard than others?
Data & Analytical Options:
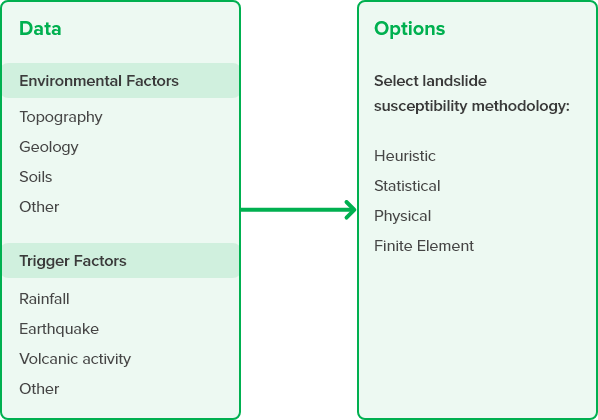
Detail of Susceptibility Models
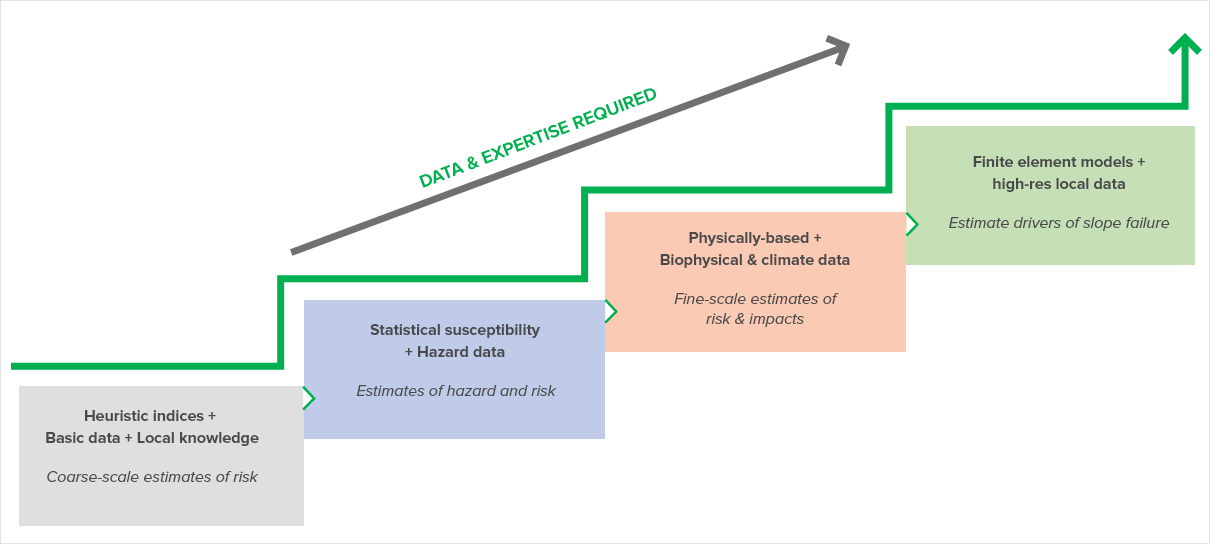
The illustration above displays a schematic of landslide model types and how they inform different types of projects. On the left, heuristic-based models can be applied with little time and resources but provide only coarse results of broad areas at higher and lower risk. As you move from left to right, the outputs become more relevant at highly local scales, but also require more data, time and expertise to implement. A variety of open-access susceptibility models are available for use.
Landslide Susceptibility Model Types
| Model Type | Finite Element Model | Physics-Based | Statistical | Heuristic |
|---|---|---|---|---|
| Description | Physically-based process model of landsides at a local (hillslope) scale. | Process-oriented methods based on physical factors and drivers of slope stability. | Data-driven, statistical approach to link observed landslides to specific local factors. | Expert-based ranking of different driving factors possibly related to landslide hazards, typically weighted and combined into an index. |
| Question Answered | How and when might a particular slope give way as driving forces change? | What impact might landscape changes have on landslide susceptibility and sediment generated? | How frequently could I expect landslides to occur in different areas? | Where might landslide hazards impact or be impacted by a proposed Bank project? |
| Guidance on Use | Prediction focused at a high spatial resolution, but cover a much smaller spatial extent. Useful for site-based projects on a single hillslope. Based on causation. | Prediction-focused, but highly sensitive to uncertainty. Require detailed spatial data on physical and geomorphic characteristics. Useful in places where occurrence data are not available. Based on causation. | Empirical models, require detailed data on physical and geomorphic characteristics, plus landslide inventory data on actual occurrences. Based on correlation + validation to observed occurrences. | Useful as an initial screening to identify whether landslides pose a risk in the project area. Based on correlation with known (or assumed) drivers of landslide risk. |
Detail on Susceptibility Model Types
| Large-scale (watershed, basin, country, etc.) | Hillslope-scale | |||
|---|---|---|---|---|
| Heuristic | Statistical | Physically-based | Finite element models | |
| Description | Expert-based ranking of different driving factors possibly related to landslide hazards, typically weighted and combined into an index. | Data-driven, statistical approach to link observed landslides to specific local factors. | Process-oriented methods based on physical factors and drivers of slope stability. | Physically based process model of landsides at a local (hillslope) scale. |
| Results | Map of susceptibility index or ranking for each pixel or region; can be overlain with assets or people at risk | Map of annual probability of landslide in each pixel; can be overlain with assets or people at risk | Maps of landslide probability, magnitude, volume of sediment displaced, and runout, for each landslide object or pixel; can be overlain with assets or people at risk | Landslide probability, magnitude, volume of sediment displaced and runout for each cell in a 3D grid |
| Question answered | Where might landslide hazards impact or be impacted by a proposed Bank project? (to prioritize project areas) | How frequently could I expect landslides to occur in different areas? (to guide early warning and preparedness, infrastructure, siting and mitigation activities) | What impact might landscape changes (e.g. land use, new infrastructure) have on landslide susceptibility and sediment generated? Where might landslides be preventable by changing or targeting project activities? | How and when might a particular slope give way as driving forces change, either because of natural drivers or new infrastructure? |
| Data required | Basic spatial data on physical properties + assets at risk | Physical properties + georeferenced data on timing and magnitude of slides (+ assets at risk) | Physical properties + assets at risk | Very high-resolution data, typically for a single hillslope |
| Expertise required | Local expert knowledge; Domain expertise | Domain expertise, spatial data analysis | Domain expertise, spatial data analysis, advanced modeling | Highly specialized domain expertise; advanced modeling |
| Stage in project cycle | Identification Preparation (ESS) | Preparation (Tech Assessment + ESS) Appraisal | Preparation (Tech Assessment + ESS) Appraisal | Preparation (Tech Assessment) Appraisal Implementation |
| Types of Bank projects useful for | Any | Infrastructure projects (roads, dams, energy, etc.), DRR | Infrastructure projects, watershed management, DRR | Design & implementation of infrastructure projects |
| Notes | Useful as an initial screening to identify whether landslides pose a risk in the project area. Based on correlation with known (or assumed) drivers of landslide risk. | Empirical models, require detailed data on physical and geomorphic characteristics, plus landslide inventory data on actual occurrences. Based on correlation + validation to observed occurrences. | Prediction-focused, but highly sensitive to uncertainty. Require detailed spatial data on physical and geomorphic characteristics. Useful in places where occurrence data are not available. Based on causation. | Prediction focused at a high spatial resolution but cover a much smaller spatial extent. Useful for site-based projects on a single hillslope. Based on causation. |
| Exemplary model/ case study(ies) | ThinkHazard! (GFDRR) The World Bank/GFDRR 2018 National-Level Landslide Risk Profiles for Sub-Saharan Africa | The World Bank 2018 Sierra Leone Multi-City Hazard Review and Risk Assessment Final Report (Volume 1 of 5): Technical Methodology and Summary of Results |
The World Bank/Natural Capital Project 2019 Valuing Green Infrastructure: Case Study of Kali Gandaki Watershed, Nepal The World Bank/GFDRR Transport Risk Mitigation Investment Plan for B2B and Salang Pass Roads, Afghanistan |
Pradhan and Siddique 2019 Stability assessment of landslide-prone road cut rock slopes in Himalayan terrain: A finite element method based approach |
Illustrative Example: Kaligandaki Landslide Risk Assessment
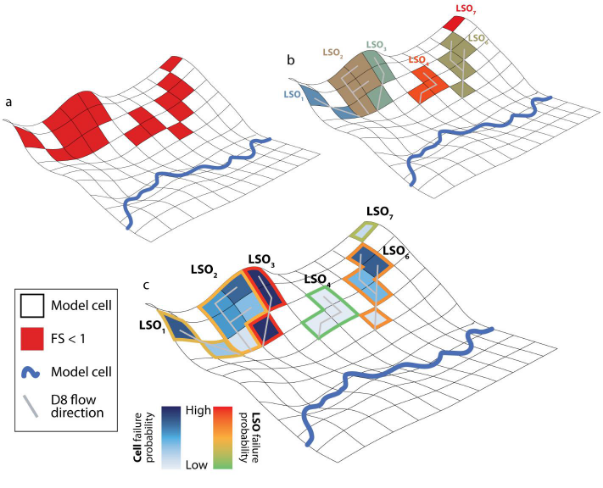
In the Kaligandaki Landslide Risk Assessment, the project team implemented a landscape-scale landslide risk assessment using the factor-of-safety approach together with a landslide run-out methodology to account for the spatial connectivity of hillslope processes. The Kaligandaki report assesses Landslide Objects (LSOs) as the unit of analysis for catchment-scale landslide hazard screenings. LSOs make it possible to understand landslide magnitude (slide extent and volume and mass of mobilized sediment), which is critical to catchment sediment and hazard management as it provides information on how well a landslide zone is connected to the river network and how much sediment might be mobilized into that network. These LSOs are identified from an analysis of downslope connectivity across failure-prone cells and are then integrated into a probabilistic hazard assessment driven by precipitation in Nepal.
Derivation of connected landslide objects (LSOs) and failure probabilities. a: Identification of conditionally unstable cells. b: Grouping of conditionally unstable cells along downslope gradients. Different colors identify the resulting downslope-connected landslide objects (LSOs). c: Identification of failure probability for single cells (blue fill colors) and aggregation of failure probability for each LSO scale (green to red outline colors). Source: World Bank, Valuing Green Infrastructure: Case Study of Kali Gandaki Watershed, Nepal.
Derivation of connected landslide objects (LSOs) and failure probabilities. a: Identification of conditionally unstable cells. b: Grouping of conditionally unstable cells along downslope gradients. Different colors identify the resulting downslope-connected landslide objects (LSOs). c: Identification of failure probability for single cells (blue fill colors) and aggregation of failure probability for each LSO scale (green to red outline colors). Source: World Bank, Valuing Green Infrastructure: Case Study of Kali Gandaki Watershed, Nepal.
Additional Resources
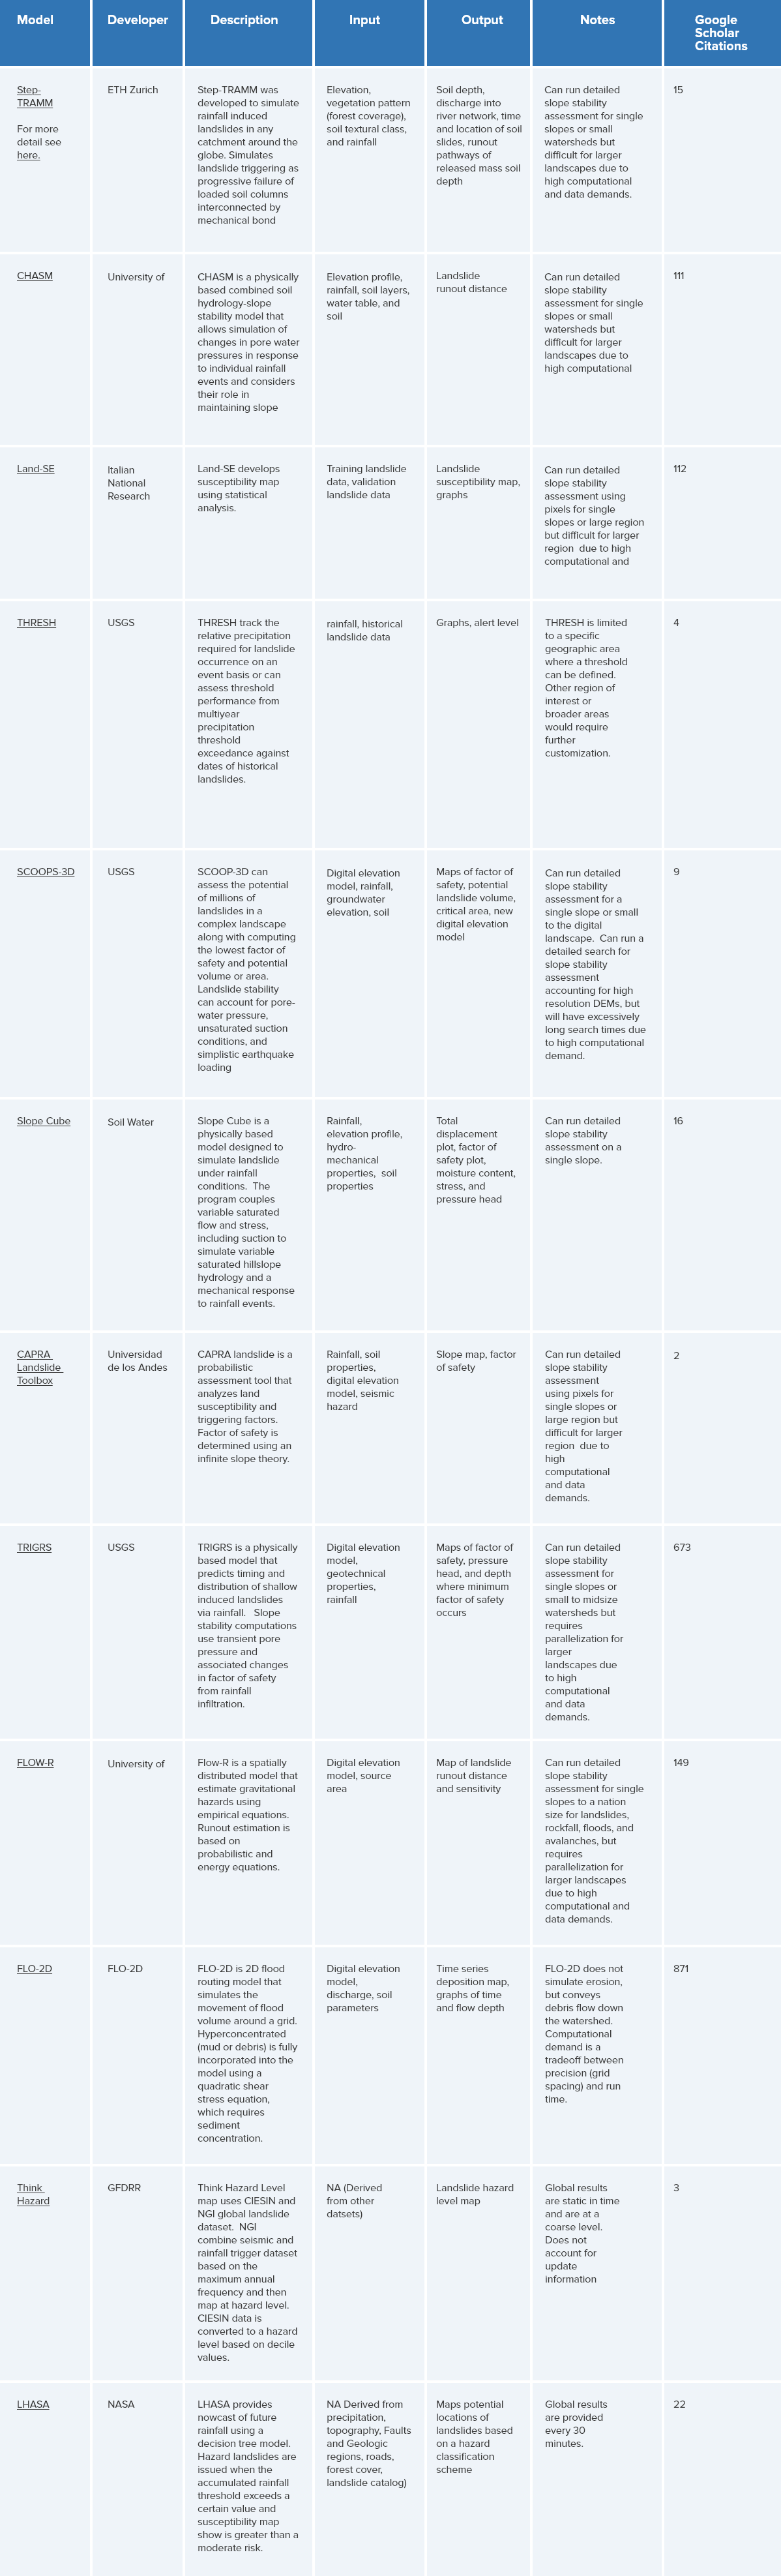
Open Access Susceptibility Models
Data Required for Varying Susceptibility Models and Scales
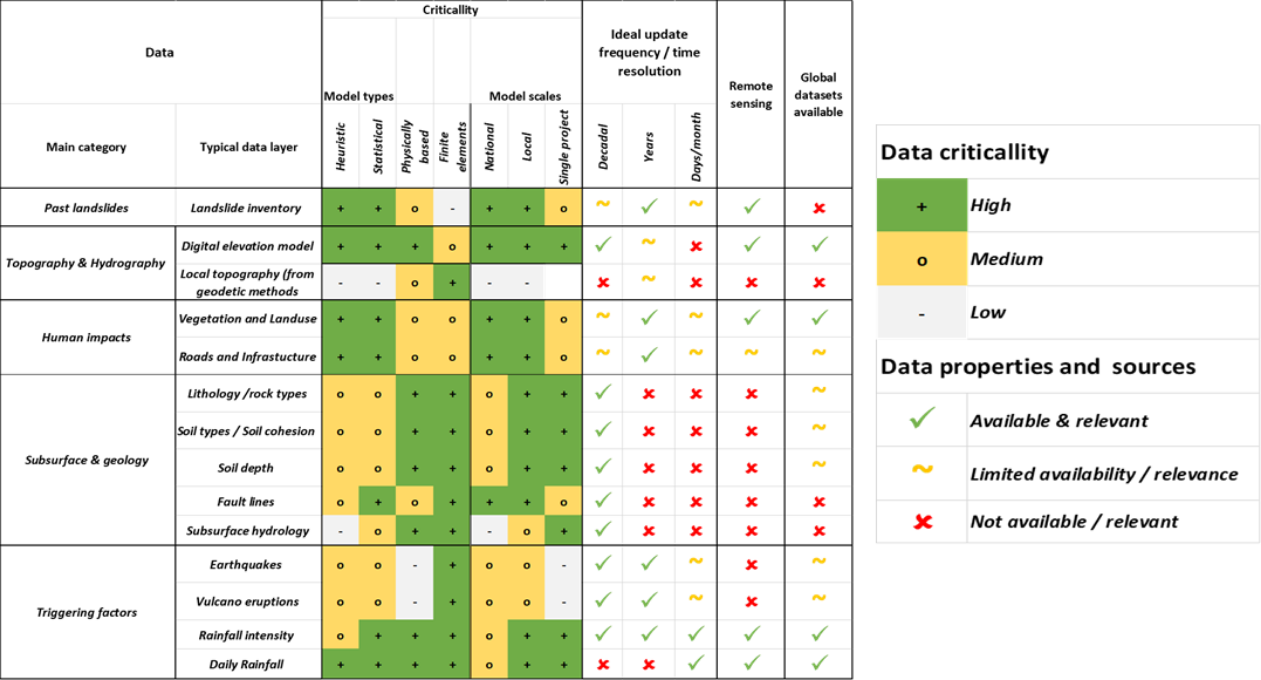 Source: Adapted from http://www.charim.net/datamanagement/23
The exposure step of the LRA identifies people, assets and infrastructure that are exposed to the landslide hazard identified in Step 2.
Description:
Inventory of exposed elements of concern: People, Buildings, Roads, other infrastructure; overlay with landslide hazard areas
Purpose:
To identify people, assets, and infrastructure exposed to the landslide hazard.
Activity:
Data collection of exposed elements of concern; overlay with landslide hazard areas identified in Step 2.
Questions Answered:
If a landslide happens, what are the elements at risk in my project area?
Data & Analytical Options:
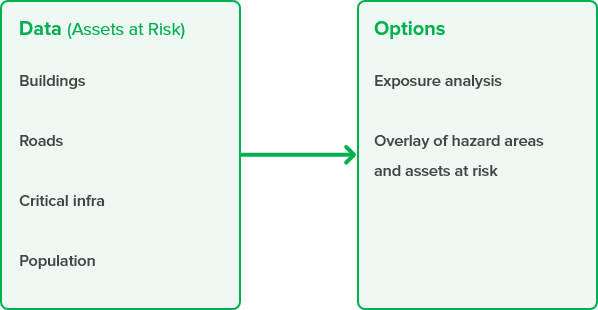
Data required to conduct an exposure assessment includes data on buildings, roads and other critical infrastructure, and population locations and densities. These data are overlayed with landslide hazard areas identified in Step 2 to conduct an exposure analysis and identify exposure hotspots.
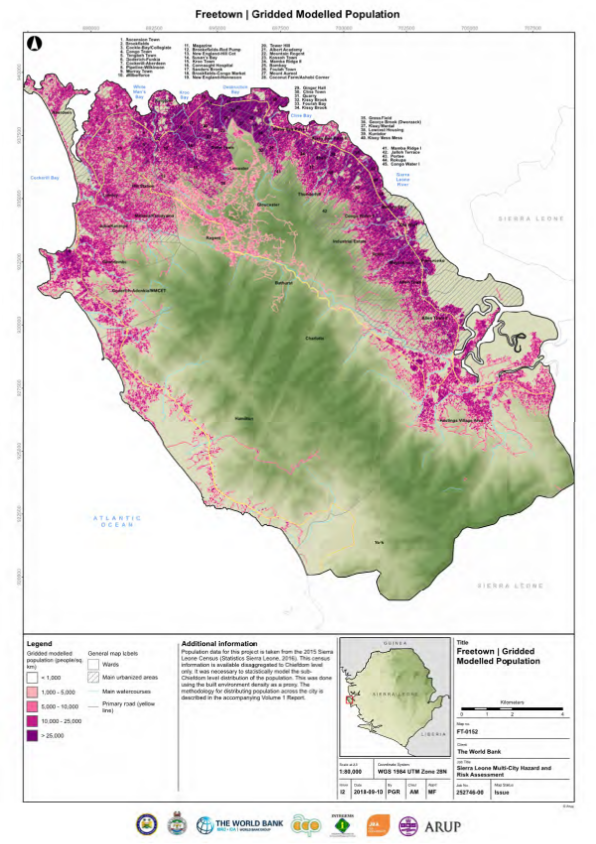
Illustrative Example: Sierra Leone
In the Sierra Leone Multi-City Hazard Review and Risk Assessment, the project team assessed exposure of people and building, road and bridge infrastructure at risk. Population density was modeled to determine exposure of people to risk, while data on spatial locations of buildings and other infrastructure were identified from OpenStreetMap . The team then expanded on the dataset using an OpenStreetMap “Hot Task” which allowed the team to input additional building, road, and bridge locations specific to the cities of Freetown, Makeni and Bo. These data are now open source, verified and publicly available. The team was also able to leverage the World Bank Rapid Damage and Loss Assessment Report completed after the 2017 landslides and floods in Freetown in order to model building type, usage and replacement value for the risk assessment.
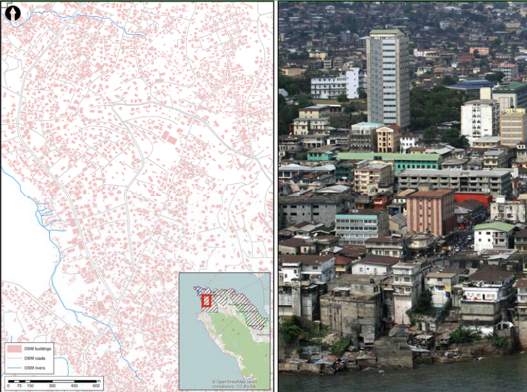
Digital exposure model for an area of Freetown, showing in pink actual building locations and types Source: World Bank, Sierra Leone Multi-City Hazard Review and Risk Assessment.
Description:
Quantification of potential damages to exposed elements (e.g. physical or population vulnerability) based on expert opinion, empirical data, physical models and other sources
Purpose:
To understand how exposed assets may be damaged by landslide events.
Activity:
Quantification of potential damages to exposed elements (e.g. physical or population vulnerability) based on expert opinion, empirical data, physical models and other sources.
Questions Answered:
If a landslide happens and impacts an element at risk in my project area, how much damage isthe element likely to sustain?
Data & Analytical Options:
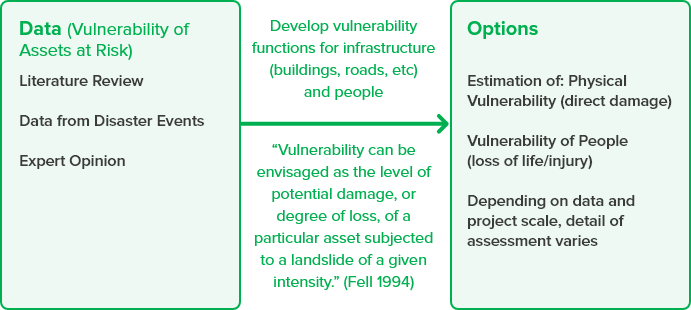
A vulnerability assessment is then conducted to understand how assets at risk that are exposed to the landslide hazard may be damaged by the landslide. Information assessed may include how many people are likely to be injured or killed by a landslide event of a given intensity; how many buildings may be damaged or destroyed and the replacement value/repair cost of those buildings; and how many roads are likely to be damaged and the repair costs associated with fixing them.
Data on vulnerability may come from a variety of sources. Data for a vulnerability assessment may come from desk-based literature reviews, where vulnerability functions can be located and transferred if appropriate to potential exposure within the project area. Vulnerability functions may also be located from data from disaster events, and from expert opinion from within the stakeholder group.
Example: Sierra Leone Case
The project team in the Sierra Leone Multi-City Hazard Review and Risk Assessment estimated the probable response of a structure to the landslide (physical vulnerability), and the injuries likely to be inflicted on impacted people (vulnerability of people).
Physical vulnerability was gauged through estimated fragility functions (probability that a specific damage state will occur when a structure is impacted by a landslide of a particular size) and loss ratios (proportion of an asset’s value that is lost due to a particular damage state resulting from a landslide) for structures using literature and expert opinion.
The vulnerability of people was estimated for people indoors and outdoors using data from landslide event in study area and literature. Vulnerability functions – probability of death in different building types.
For Freetown specifically, the project team modeled numerically the fragility of buildings and roads and the vulnerability of the population to landslide risk. A fragility function relates, for example, the depth of flood water to severity of building damage for specific property types. Vulnerability functions relate the fragility function to the estimated number of injuries and/or fatalities for people exposed to the hazard. The project team primarily modelled physical vulnerability, but social vulnerability was also assessed using differences between population distributions in formal, planned areas and informal, unplanned areas.
Description:
Quantification of the annual expected landslide risk to exposed people (fatalities) and structures (financial losses)
Purpose:
To quantify losses due to the landslide hazard.
Activity:
Quantification of the annual expected landslide risk to exposed people (fatalities) and structures (financial losses).
Questions Answered:
Based on the damages sustained, what is the risk associated with my project area (e.g. lives lost, value of damage)?
Data & Analytical Options:
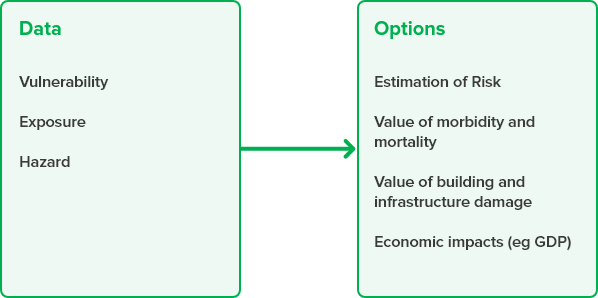
Risk assessment quantifies potential losses. LRA step 5 is the risk assessment, where losses resulting from the landslide hazard are quantified using the exposure and vulnerability estimates in the LRA. Risk is calculated as the product of the hazard, exposure, and vulnerability on a pixel basis in the spatial environment.
Losses can be presented for various assets at risk. Common risk estimates are for the value of morbidity and mortality; the value of building and infrastructure damage; and the economic impacts (e.g. impacts to GDP).
Illustrative Example: Africa National Risk Profiles
Risk estimation occurs on a grid-square basis. For each grid-square, the landslide hazard score, the inventory of elements at risk and the vulnerability of those elements are combined to produce a risk metric for that square. In the Africa National Landslide Risk Profiles, the project team aggregated the grid squares to produce a national-level spatial distribution of landslide risk for each country. Risk is presented as number of fatalities, number of people affected, risk to building stock and critical facilities, risk to road and rail networks, and risk to GDP. The risk to GDP and population are given for both a 2010 and 2050 scenario.
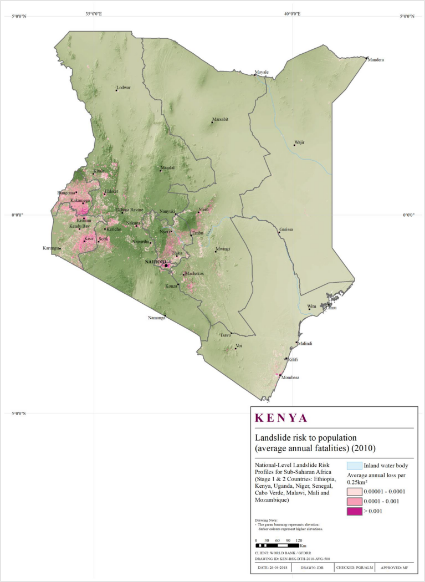
Example of the result of the landslide risk assessment for the general building stock in Kenya, 2010