GFDRR Africa National Landslide Risk Profiles [DRM/National]
From 2015-2016 the World Bank and GFDRR contracted Ove Arup & Partners International Ltd (Arup) and the British Geological Survey (BGS) to characterize national-level landslide risk for a total of nine Sub-Saharan African countries (Stage 1, 2015: Ethiopia, Kenya, Uganda, Niger and Senegal; Stage 2, 2016: Cabo Verde, Malawi, Mali and Mozambique). In 2018, Arup was contracted to re-run risk calculations for all Stage 1 and Stage 2 countries based on revisions to the exposure datasets used.
Outcomes of the risk assessment are:
- National-scale landslide hazard footprints
- Landslide risk analyses for each country and
- The quantification of financial costs for various landslide scenarios (i.e. loss metrics).
Landslide risk is estimated for the following metrics for a 2010 scenario:
- Population (fatalities and number of people affected)
- Structural and infrastructural assets
- Critical bridge, educational, energy, government and healthcare facilities and
- GDP.
The assessment also estimates landslide risk to population (fatalities and number of people affected) and GDP for a 2050 scenario based on climate and population predictions provide in the ToR and available exposure data.
Data
Datasets used for landslide susceptibility assessment
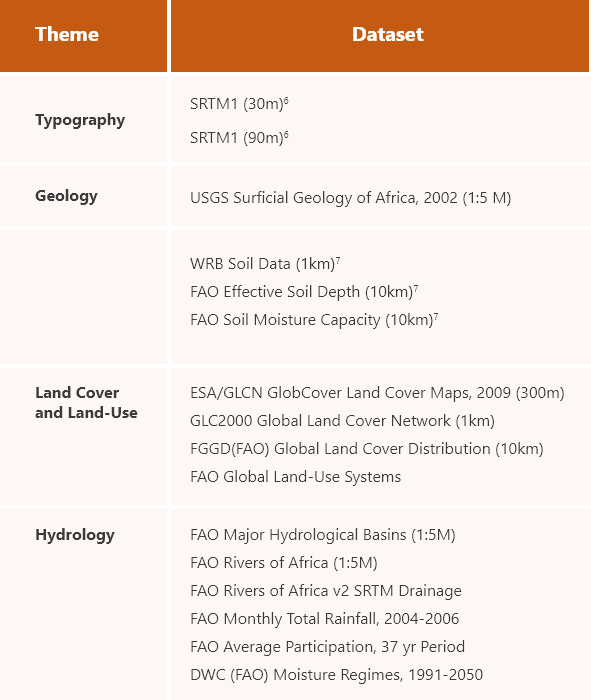
Methodology
The methodology for landslide risk assessment for each country included in the 2018 analysis was as follows:
Step 1: Identify/characterize landslide hazard in each country:
In order to identify and characterize landslide hazard in each country, the assessment first conducted a systematic literature review and web search in order to identify national or terrain-specific landslide inventory data. These inventory data were used to classify landslide location and size and to identify susceptibility and triggering factors in each of the countries.
Step 2: Determine landslide hazard:
Landslide hazard is quantified as equal to landslide susceptibility multiplied by the landslide trigger. Hazard is estimated using susceptibility and trigger data collected during the hazard identification stage. In the absence of detailed landslide inventory data, the assessment determines the probability of landslides using the landslide hazard score as a proxy for the approximate annual frequency of a landslide event within the grid. This method follows from Nadim et al 2013.
Landslide Susceptibility
Literature on relevant smaller-scale landslide studies in Sub-Saharan Africa were used to identify key factors that contribute to susceptibility. Landslide susceptibility is determined by identifying and ranking factors that contribute to susceptibility, weighting those factors, and then summing them to arrive at a susceptibility score. It is important to note that susceptibility factors will differ from country to country and across different climatic and geologic types, and are not easily transferable from one location to another. It is also important to note that landslide inventory data on which to test the weights applied and calibrate results were limited to published maps from Malawi. The assessment used these, and also expert judgement to select the weights.
Landslide Triggers
The assessment considered both rainfall and earthquake triggers for landslides, but did not consider anthropogenic triggers. Rainfall-triggering of landslides is quantified by applying a multiplier to the susceptibility score. This multiplier is estimated from long term and extreme rainfall data from the Global Precipitation Climatology Centre dataset and is a proxy for rainfall triggering as it is not related to return periods of rainfall events directly. Seismic hazard was estimated for eight structural periods using Ground Motion Prediction Equations with (WSE model based on the USGS v30 estimate approach) and without site effects (NSE). It is important to note that this assessment did not assess landslide run-out as this is typically not done for landslide hazard assessment at a national scale.
Step 3: Determine Exposure:
The assessment inventoried the elements at risk (“exposure”) using a variety of data that provided estimates of the location, size, replacement cost and structural attributes of buildings; the location of critical facilities, rail and road networks; the spatial distribution of the population in each country for the 2010 and 2050 scenarios; and the spatial distribution of GDP in each country for the 2010 and 2050 scenarios. These data were pre-processed to be at the same spatial resolution. The probability of exposed elements at risk being impacted by landslides is determined by the size/area of the landslide, the area of the grid-square containing the asset, and the area of the exposed asset (e.g. a building’s footprint.
Step 4: Determine Vulnerability:
The assessment defines landslide vulnerability according to Fell 1994, “Vulnerability can be envisaged as the level of potential damage, or degree of loss, of a particular asset subjected to a landslide of a given intensity.” Both physical vulnerability (direct damage caused to structures and infrastructure) and human vulnerability (whether a landslide event results in fatalities or injuries to people both within and outside of buildings) are estimated. Impacts vary on a scale from no loss (assigned a value of 0) to total loss (assigned a value of 1).
Step 5: Estimate Landslide Risk:
Landslide risk estimation occurs on a grid-square basis. For each grid-square, the landslide hazard score, the inventory of elements at risk and the vulnerability of those elements are combined to produce a risk metric for that square. The aggregation of the grid squares allows for the national- level spatial distribution of landslide risk for each country. Risk is presented as number of fatalities, number of people affected, risk to building stock and critical facilities, risk to road and rail networks, and risk to GDP. The risk to GDP and population are given for both the 2010 scenario and the 2050 scenario.
Results
The maps below illustrate the results of the assessment, and the level of detail the results provide.
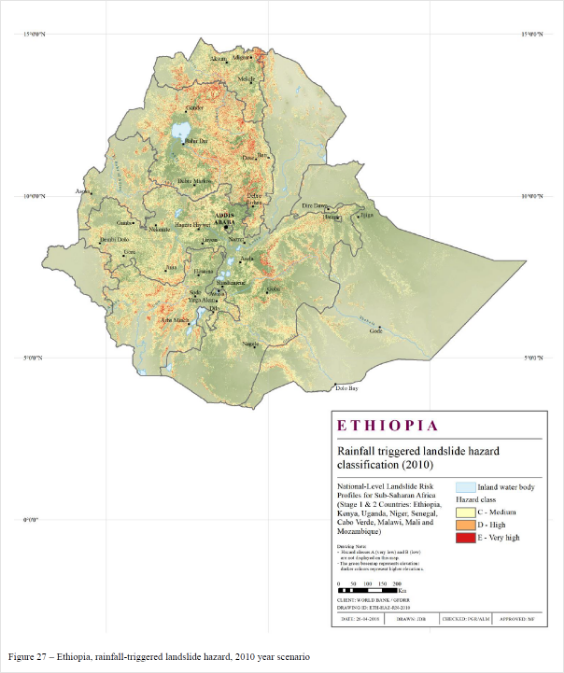
Example of a national level landslide hazard classification map for Ethiopia 2010
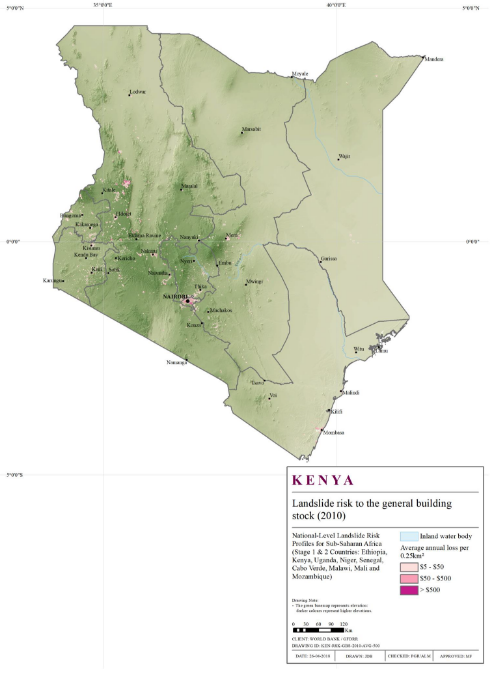
Example of the result of the landslide risk assessment for the general building stock in Kenya, 2010.
Key Takeaways
The national landslide assessments completed under this activity included a number of assumptions and data proxies that limit the use of results to high-level assessment. However, the risk profiles completed are an improvement over the existing data on landslide risk for these countries, which were limited primarily to global estimates of landslide risk.
A number of assumptions and data proxies are used in this national-level landslide risk assessment. A number of assumptions are required to complete landslide risk assessments in data poor environments. Some of these assumptions have been detailed above; others are available in the full report. Key methodological assumptions and proxies include:
- Definition of a landslide as including both the source and debris areas; however the mechanism/rate of mass movement from source to debris area is not included
- Landslide runout is included but landslide flow-path analysis are not
- The 500-year return-period Peak Ground Acceleration (PGA) is used as a proxy for landslides triggered by seismic activity
- A multiplier estimated from long-term average rainfall is used as a proxy for landslides triggered by rainfall
- Landslide frequency is estimated based on existing global landslide risk due to limited country-specific landslide inventory data, and the frequency of landslides of different sizes is estimated based on literature on the relationship between landslide size and frequency
- Landslide risk is estimated on a grid-square basis, and the landslide risk in one grid-square does not impact the risk in nearby grid-squares
- Building and energy facility footprint areas are assumed
- Site-specific measures to mitigate landslide risk (may impact national- level landslide risk) are not included; and
- Risk to GDP is estimated with a multiplier to direct losses based on Hallegatte 2015.
Given the number of assumptions made and the geographic resolution of the results, these national-level assessments are appropriate for use as high-level guidance only. The assessments do not substitute for regional or more detailed local and/or site- or project-specific risk assessments that may be required for decision-making and prioritization on smaller scales. The assessment notes that the results presented are of sufficient spatial resolution and precision for the following uses:
- Assessment of landslide hazard and risk at a spatial resolution of roughly 500x500 meter
- High-level assessments of national-level landslide risk and costs (annualized population losses, costs to buildings and infrastructure, and loss of GDP)
- Identification of landslide hazard and risk at the Administration Level 1 for each country
- Identification of areas in which to conduct more detailed landslide risk assessment
- Identification of spatial and temporal trends in landslide hazard and risk between 2010 and 2050
- Risk prioritization through landslide risk mitigation measures for those areas with the highest landslide risk; and
- Provision of risk metrics that could be used in cost-benefit analysis of risk management priorities.