Sierra Leone Multi-City Risk Assessment [DRM/Subnational]
Introduction
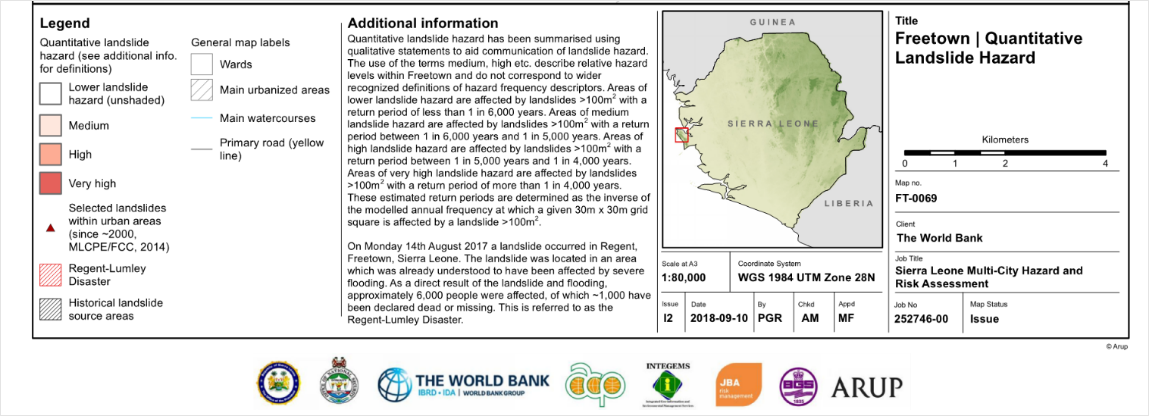
The World Bank and GFDRR, with funding from the Africa Caribbean Pacific – European Union (ACP-EU) , supported the Sierra Leone Multi-City Hazard Review and Risk Assessment activity that conducted city-level individual natural hazard and risk assessments and provided quantitative hazard and risk estimates for the cities of Freetown, Makeni, and Bo. The purpose of the assessment was to provide guidance to the Government of Sierra Leone and other stakeholders for prioritization of disaster risk reduction and disaster risk management options. The activity resulted in an overview report of the methodology, and individual risk assessment reports for each city available here. In 2017, the project team also completed a Rapid Damage Loss Assessment when the Regent-Lumley flood and landslide disaster happened in Freetown on August 14. The project team included Ove Arup and Partners International Ltd (Arup) (lead organization), the British Geological Survey (BGS), JBA flood risk consultancy, and the Integrated Geo-information and Environmental Management Services (INTEGEMS) consultancy.
The project began with a qualitative stock-taking of risks (flooding, landslides, sea-level rise, and coastal erosion) to the three cities, as well as a review of existing DRM and urban planning policies. The results of the qualitative assessment were used to define the scope of and inform the quantitative risk assessments conducted. The study also included a cost-benefit analysis allowing for prioritization of potential DRM investments that could mitigate risks identified through the hazard and risk assessments. High-level DRM and urban planning policy recommendations that flowed from the study were also meant to be incorporated into urban master planning efforts for the three cities.
Data
The team used building exposure data from Open Street Map, and used a Humanitarian Open Street Map team (https://www.hotosm.org/) “HOT task” that enabled the team to extend the coverage of the initial exposure model by digitally mapping thousands more buildings, roads and bridges to this dataset for Freetown, Makeni and Bo, specifically for this project. These data are now open source and available to the three cities.
The team leveraged new information made available following the Regent-Lumley Disaster about the replacement value of buildings. The information is summarized in the DaLA Report (World Bank, 2017). For consistency, the replacement values used to produce the DaLA have been used for this study.
Lower estimate rebuild values for roads used values from the World Bank Project, National-Level Landslide Risk Profiles for Sub- Saharan Africa (Stages 1 and 2) (Arup-BGS, 2017). The upper estimate rebuild value for roads used values from the World Bank Project, Measuring Seismic Risk in Kyrgyz Republic and expert judgement.
Methodology
The activity undertook both a qualitative and quantitative hazard and risk assessment.
Qualitative Risk Assessment
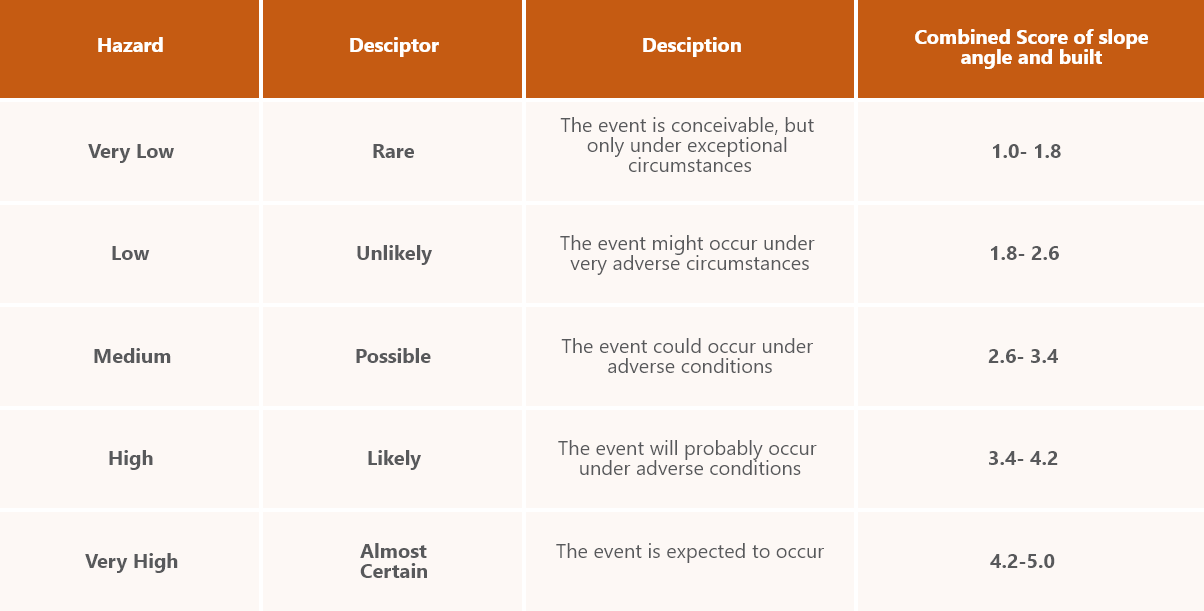
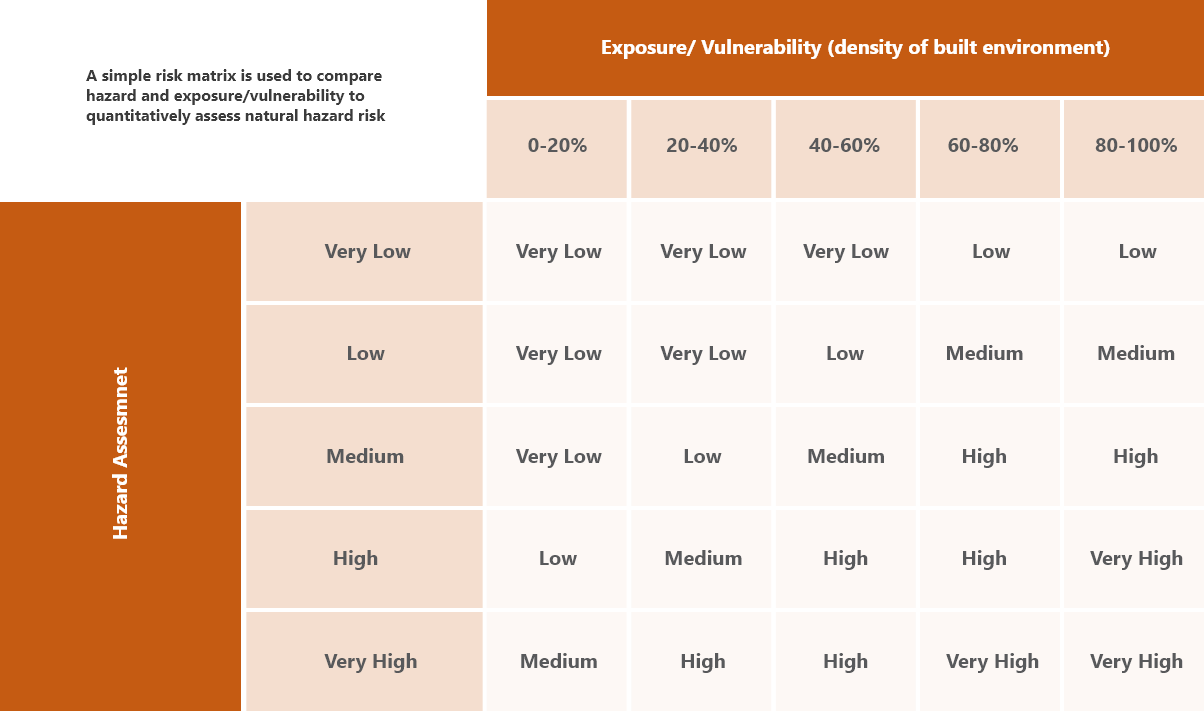
The qualitative hazard and risk assessments were conducted using expert judgement and local knowledge to classify areas of low, medium, and high hazard and risk for flooding, landslides, coastal erosion, and sea level rise in all three cities. Note that the qualitative risk assessment was completed for all hazards and did not differentiate between type of hazard. The qualitative landslide risk assessment assigned score ranges to slope angle and built environment density (study-specific factor added because the activity missions and literature review showed that building habits in Sierra Leone can cause landslides ) and then multiplied the scores with a weighting of 75:25 to arrive at a combined score and rank the hazard values accordingly (see Table below on the scoring).
Scoring for qualitative landslide hazard assessment
The qualitative risk assessment resulted in the risk assessment detailed in the table below. As shown, risk was assessed across all hazard types and risk presented qualitatively in categories ranging from “very low” to “very high”.
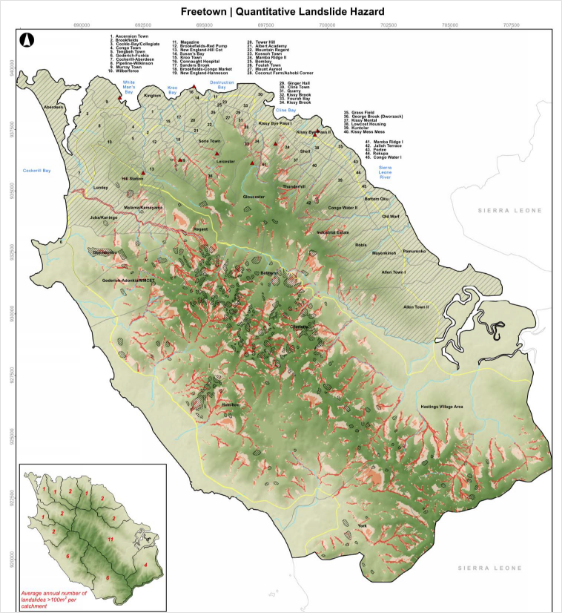
Quantitative Landslide Risk Assessment
For the landslide risk assessment, the quantitative hazard and risk assessment modeled susceptibility, hazard, exposure and vulnerability to develop risk estimates of for example, the number of people affected and buildings damaged, for Freetown only.
For the city of Freetown, the quantitative landslide risk assessment included the following components:
Landslide susceptibility assessment.
The susceptibility assessment in this project used data on elevation, slope angle, slope aspect, and the distance to the nearest river to calculate a Landslide Susceptibility Index (LSI) (Chalkias et al 2014). Each of the factors was classified (e.g. slope angle was categorized into 0° – 10°, 10° – 20°, etc…) and the study analyzed the frequency with which landslides occurred for each category for each susceptibility factor. A susceptibility score was assigned to each pixel, with the pixels with the highest 25% of scores categorized as having high landslide susceptibility (following Jaiswal 2011). The study calibrated the model using data on more than 400 landslide events identified through a literature review. The high landslide susceptibility class contains roughly 75% of landslides identified through the landslide inventory. The study therefore provides an assessment of slopes that could fail based on their characteristics and also on past landslide locations.
Landslide hazard assessment.
The hazard assessment included both (1) frequency-magnitude analysis that indicates the frequency at which landslides of varying sizes occur within the landscape; and (2) runout modeling , which uses a Gravitational Process Path (GPP) model to estimate the probability that a specific cell in a digital elevation model will be impacted by landslide material coming from another cell. The study notes that this approach to runout modeling can “…provide a reasonable approximation of landslide runout probability at city-scale and provides sensible results when used with a 30m spatial resolution digital elevation model.” The study estimates the annual frequency that a given pixel is affected by a landslide as the product of the annual frequency of triggering (the annual frequency of landslide occurrence at the initial pixel) and the probability that the pixel would be affected by flow from another initial pixel. Additional detail on the two components of the hazard assessment are given below.
The frequency-magnitude analysis categorized landslides of different magnitudes in Freetown based on rupture surface area (e.g. Magnitude 1 = landslide with a rupture surface area between 100m2 and 1,000m2), and does not consider landslide debris depth/volume. The assumption is made that landslides with larger rupture areas might mobilize deeper depths of debris. Magnitude categories are based on the distribution of landslide rupture surfaces from the landslide inventory. It is important to note that the landslide inventory did not provide the time period of each landslide that would allow for a direct estimate of the annual landslide frequency for each magnitude class; the study therefore assumed that the inventory accounts for between 500 and 3,000 years of landslides. The study also assumes that each class of landslide magnitude is underreported, with smaller landslides underreported more often than larger landslides. The study therefore applies a “completeness factor”: e.g. for magnitude 2, the study assumes that only between 25% and 50% of all landslides that have occurred are represented in the landslide inventory. Finally, the study notes that magnitude 1 landslides are not well represented in the landslide inventory because they are difficult to identify from historic satellite imagery, are underreported in populated areas, and small landslide events are often associated with human activity. Due to a lack of information from the landslide inventory, the study models the annual frequency of Magnitude 1 landslides between 10 and 100 events across the study area and assumes that landslides smaller than 100m2 cannot be identified at the city scale.
For the runout modeling, the methodology of the GPP model is as follows for pixels assigned medium or high landslide susceptibility from the susceptibility analysis AND categorized as magnitude 2-5 landslides :
- A landslide initiates from a specific pixel in a DEM.
- Flow occurs between the initial pixel and surrounding pixels at lower elevations.
- The probability that the flow will occur is based on the elevation difference with the initial pixel (flow is more likely with greater elevation difference). This probability is used to determine a weighted-random flow path from the initial pixel to impacted pixels.
- The process repeats until the model arrives at a predetermined limit (e.g. maximum landslide length) or flows into a depression in the DEM.
- The flow path process is repeated a number of times and the probability assigned that a flow path will impact a given pixel based on the number of times the pixel was included in the flow path divided by the number of model runs.
3 The study does not estimate flow paths for Magnitude 1 landslides because the spatial resolution of the DEM exceeds the landslide size.
Landslide vulnerability assessment.
Once the probability of a landslide reaching a certain pixel has been established (susceptibility and hazard analysis), the vulnerability assessment identifies structures and people in the path of the landslide and the probable response of the structure to the landslide, or the injuries likely to be inflicted on impacted people. The vulnerability assessment in this study was informed by a literature review and data gathered from the 2017 Regent-Lumley Disaster, and estimated impacts of landslide events on population, buildings, and infrastructure assets. Physical vulnerability was assessed for buildings and structures based on the direct damage caused to these assets; the vulnerability of people was assessed based on whether or not a landslide event would result in injuries or fatalities.
The physical vulnerability of buildings was assessed as superficial, functional, or structural damage, which is determined by the condition and construction type of the building. Physical vulnerability can be very detailed at the site-specific level, where an assessment might drill down to the actual size and composition of the landslide material hitting a structure, and the precise point of impact on a building or structure. The study provides Pitilakis et al 2011 as an example of this. For regional or city-scale studies such as the current study, broader categories of structure types and conditions are required, such as those in Du, Nadim and Lacasse 2013. Two methodologies for quantifying physical vulnerability are: (1) bulk vulnerability functions, which estimate the damage state that occurs when a structure is impacted by a landslide of a particular size; and (2) fragility functions, which estimate the probability that a specific damage state will occur when a structure is impacted by a landslide of a particular size. The current study uses a fragility function approach. The study defines fragility functions using published bulk vulnerability functions and expert judgement for impacted structures.
Fragility functions were defined to assess the physical vulnerability of roads following from Pitilakis et al 2011. This study includes a methodology for assessing the fragility of different types of roads (from their construction type) that is based on expert judgement synthesized from 47 academic, government and industry experts from 17 countries. Fragility functions for roads in this study were developed from the Pitilaki et al 2011 study for “low speed” and “high speed” roads.
Loss ratios were estimated for both structures and roads, defined as the proportion of an asset’s value that is lost due to a particular damage state resulting from a landslide. These ratios relied on Lee and Jones 2004. While the loss ratio is used for all assets, the fragility of assets varies by type of asset, and so the vulnerability of assets to loss ratios from landslides differs by type of asset.
The vulnerability of people to landslides was assessed for people assumed to be indoors and those assumed to be outdoors during a landslide event. The vulnerability of people indoors is based on the type and condition of buildings impacted by a landslide, as this determines the likely damage state of the building and therefore the injuries the people within experience. The study assigned vulnerability functions that indicate the probability of death for a single occupant in different building types (that are subject to different damage states) resulting from landslides of different magnitudes. For example, the probability of death for an occupant in a building suffering structural damaged is modeled as 0.5-0.7 for planned buildings. The study benchmarks modeled values against data collected after the Regent-Lumley Disaster landslide for the DaLA, where the high-level estimate of probability of death from being in a building obtained through household survey work was 0.4 (the landslide rupture area is classified as a magnitude 4 landslide under this study). The study notes that this is likely to be an underestimate because the survey does not include households where every occupant died as a result of the landslide. Vulnerability of people outdoors is captured in vulnerability functions that describe the probability of death for landslides of various magnitudes. The estimates developed by the study rest on sources from the literature review such as Finlay, Mostyn and Fell 1999 and Bell and Glade 2004.
Landslide risk assessment.
Landslide risk is calculated as the probability of landslide hazard (a landslide event that causes damage) and it’s impacts (people/assets exposed x the vulnerability of those people and assets to injury/damage). Landslide risk is estimated for population, buildings, and infrastructure on a 30m pixel-wide basis and are then combined to develop an average annualized landslide risk for Freetown. Landslide risk is presented as a range. The lower bound estimates risk associated with a lower bound estimate of the annual frequency of landslide of different magnitudes, and the upper bound estimates risk associated with an upper bound estimate of this frequency. The example risk methodology for buildings is provided below; detailed methodology for population and infrastructure are available in the report.
For buildings, landslide risk is estimated on a building-by-building basis using the buildings exposure dataset using the following methodology:
- Estimate annual frequency that the 30m pixel containing the building is impacted by landslides of different magnitudes (lower and upper bound of the annual frequency estimate for each landslide magnitude class).
- Estimate the probability that the building is impacted by landslides of varying magnitudes. Note that for Magnitudes 2-5 this value is “1” because the landslide size is greater than the pixel size (30m). For magnitude 1 landslides, the value is set to the building area divided by the pixel area.
- Estimate the product of the probability that the building is impacted by the probability the building experiences a certain damage state resulting from landslides of different sizes.
- Multiply the annual frequency with which the 30m pixel in which the building is located is affected by landslides of each magnitude class but the probability that the building is impacted and suffers a given damage state from landslides of different sizes by the loss ratio for that damage state and the rebuild value of the building.
- Sum all possible damage states and landslide magnitudes to arrive at an estimate of the average annualized landslide risk.
Results
Quantitative results following the methodology above are summarized in the table below. These results were estimated by disaster type for Freetown only. The project also generated a digital exposure model for Freetown, showing the spatial inventory of the population, buildings (including the estimated building usage categories), and roads on a 30m x 30m grid. This grid size is suitable for assessing city-wide hazard and risk
For Freetown only, quantitative risk estimates were provided:
Summary of quantitative risk results for freetown
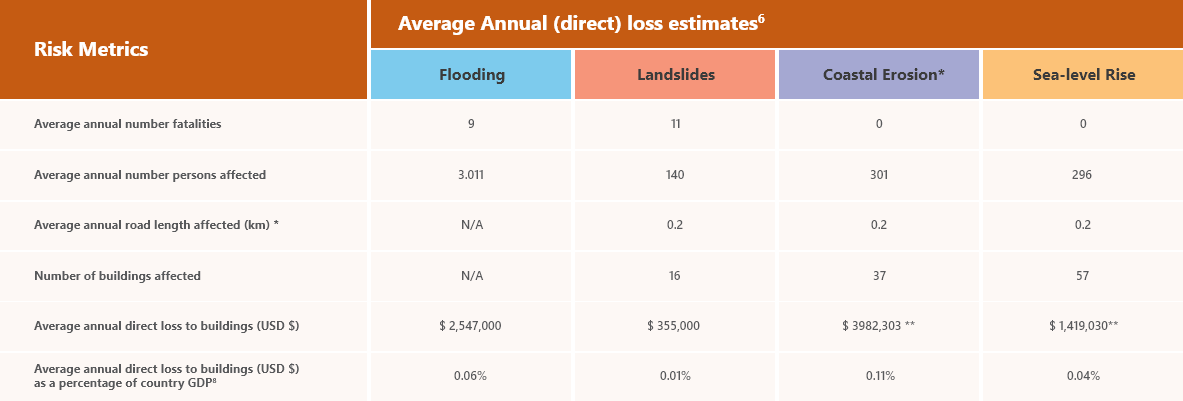
* 2050 scenario including climate change
** The 2050 scenario average value estimate has been divided by 33 years to estimate AAL.
Future population growth and increase in buildings has not been considered in the 2050 scenario numbers
Disaster Risk Management Measures
Disaster Risk Management Measures
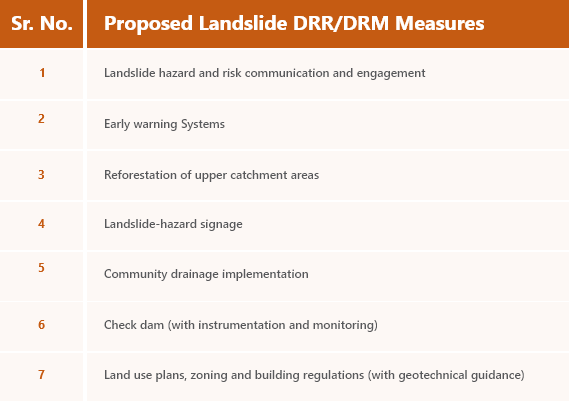
The study considers and prioritizes potential DRR/DRM measures for each hazard in each city on a catchment-by-catchment basis, including cost estimates. The measures were prioritized based on their practical appropriateness and cost effectiveness through a cost-benefit analysis that followed from the quantitative risk assessment. Table X provides a summary of the range of DRR/DRM measures considered for landslide hazard. To estimate the benefit of DRR measures, risk was calculated (cost of damage to buildings and infrastructure and number of fatalities) with and without DRR measures, and compared to capital and operational costs of the measures over 33 years. Importantly, some of the DRR/DRM measures include nature-based solutions such as the reforestation of the upper catchment area. The study provides, for example, a map of potential reforestation areas that overlay areas of high landslide hazard and high deforestation and construction activity. The study also suggests implementation of the Management of Slope Stability in Communities (MoSSaiC) method in Freetown.
Summary of the broad range of DRR/DRM measures considered for landslide hazard
Nature-Based Mitigation
The study notes that “international good practice for DRM measures (flood risk management in particular) is moving towards holistic, sustainable, green, urban drainage systems” (see Forbes et al 2015 and Woods Ballard et al 2016) and that nature-based DRM measures has the potential to be a cost-effective solution alongside hard engineering solutions. The study provides cost estimates for reforestation and revegetation, and, following from the landslide risk assessment and a cost-benefit analysis, suggestions for priority locations to implement these nature-based solutions at the catchment level for Freetown.4
While the cost-benefit analysis showed that reforestation and revegetation of all catchments across Freetown was expensive and could not be justified from a cost-benefit perspective on risk reduction benefits alone, the study did take a deeper dive into these nature-based methods in specific catchments of Freetown with highest flood and landslide risk and identified catchments where the cost-benefit ratio was more favorable. In these areas, the study estimates that reforestation could result in a risk reduction from flooding and landslides of 55%.
Following from the analysis and recommendations, reforestation was undertaken in certain catchments of Freetown. UNOPS trained 40 local residents in forestry and tree husbandry, who planted 7,500 trees on landslide-prone areas to stabilize slopes and reduce rainfall runoff that increases both landslide and flood risk. The following link details the NBS mitigation methods employed in Freetown.
4 The cost of reforestation and revegetation is estimated at US$12,400 per hectare (US$7,200 for cost of trees per hectare and US$5,200 for cost of labor to plant trees per hectare). Costs are based on information from a recent UNOPS project undertaken in Freetown from 2017-2018.
Key Takeaways
- This study conducted multiple risk assessments in one project: flooding, landslides, and coastal erosion and sea-level rise, and showed the benefits of surveying all hazards and getting the risk assessment done for all in the course of one project. The team also completed a stock-taking of issues in Sierra Leone that lead to increased disaster risk and addressed these in their recommendations.
- This study demonstrates the application of a collaborative team effort to assessing natural hazard risk in hazard-prone cities. The team leveraged global literature and expert knowledge to assess landslide risk. The team also leveraged existing global datasets but developed city-specific datasets where possible and provided open access to new datasets generated (DEM for Freetown and also the housing data). The team showed the benefits of leveraging data as it becomes available during the project cycle (from the disaster assessment).
- This study is a city scale study and results have been reported and discussed at city scale. Data input at city scale does not allow for output at detailed resolution and would not be appropriate for design of individual engineering structures.
- There are many limitations and assumptions of data input and modelling practices necessary for a city-scale study in a data-poor region. These have been addressed in the Methodology Report (Volume 1).