This section offers guidance on the steps involved in implementing an LRA. LRAs are complex and more sophisticated models require domain expertise. Therefore, the goal of this section is not to train a project team to be able to conduct a sophisticated LRA where domain expertise on the team does not exist, but rather to explain the steps and data involved in order to allow the project team to develop project objectives and hire the right consultant for the job.
Some or all of the LRA steps may be included in the specific LRA selected by the team, depending on the level selected. For example, a Level 1 LRA may map onto Step 1 here, where landslide hazard is identified through global data assessment and stakeholder consultation, which may yield more localized data and information. A level 2 LRA would likely include Steps 1 and 2, while a Level 3 LRA would include Steps 1 through 5. A Level 4 LRA would also include Steps 1 through 5, adding in a cost-benefit analysis as well.
This section first discusses general characteristics of LRAs, and then dives into specifics for each step. Additional resources are provided for each step.
Phase 2 Activities & Output

Video: Landslide Risk Assessments for Decision Making
Landslide risk assessment can have qualitative and quantitative components. These elements can be combined when assessing landslide hazard, exposure and vulnerability to calculate risk. Qualitative components usually rely on expert opinion to develop rankings or weighted indices. Quantitative components use direct data that may be available either through direct observation or estimated through statistical analysis.
Potential Qualitative and Quantitative Components for Landslide Susceptibility
| LRA Component | Input Data | Final Risk Output | Pros/Cons |
|---|---|---|---|
| Qualitative | Expert-based ranking of the driving factors possibly related to landslides |
Maps that identify relative lower
or higher landslide risk -
|
Less data, Time, Money Leverages expert knowledge |
| Quantitative | Historic landslide inventory Physical factors | Map of cells showing where
landslides may occur under a
given set of conditions -
|
More data, Time, Money Uncertainties can be high Quantifies risk objectively Allows for comparison across areas Allows for cost-benefit analysis Allows for prioritization of risk reduction measures |
Qualitative susceptibility: an expert-based ranking methodology of different driving factors possibly related to landslides. A qualitative hazard ranking yields maps that identify higher or lower landslide risk. This method takes local expert knowledge into account and can include factors that cannot be easily integrated into physical models of landslide risk but results in a ranking rather than a quantitative measure of landslide hazard and is not easily transferrable to other locations.
Quantitative susceptibility: a data-driven methodology linking observed landslides to specific local factors. Quantitative susceptibility yields a map of cells showing where landslides may occur under a given set of conditions. The approach is data-driven and results in a quantitative risk assessment that includes factors that cannot be easily integrated into a physical model but requires training data and is not easily transferrable to other locations.
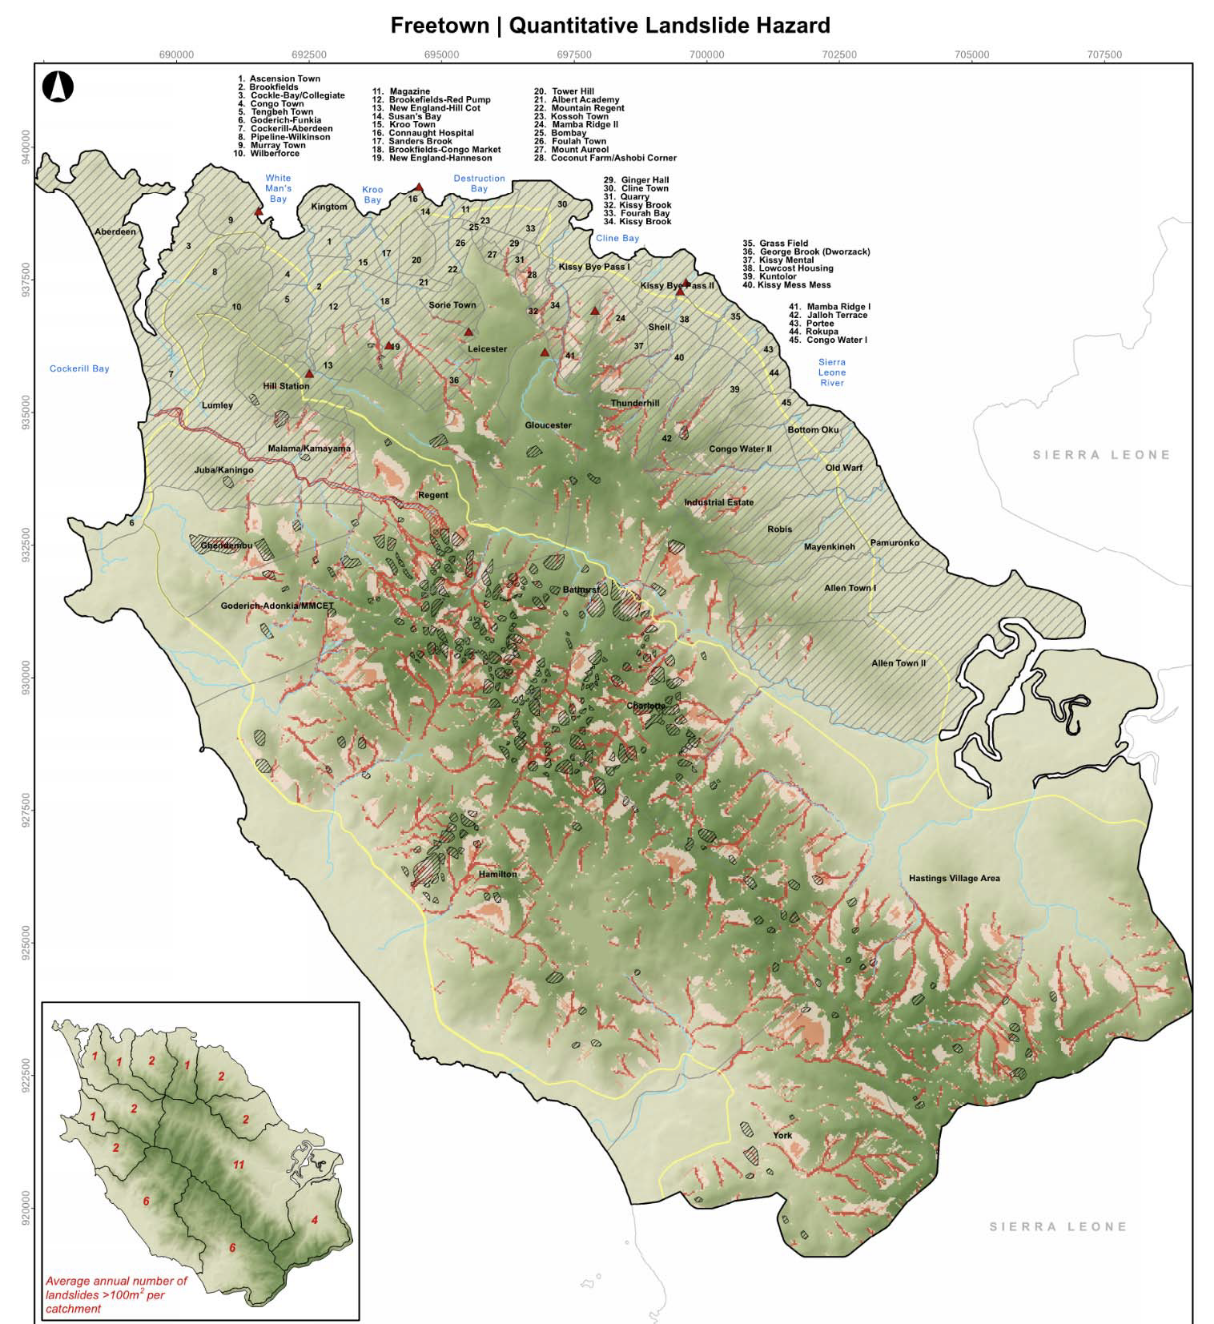
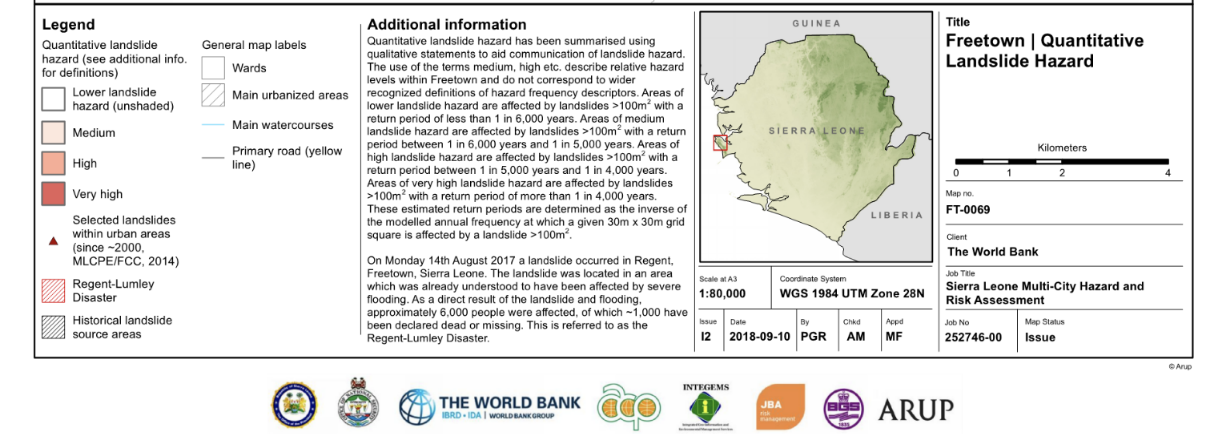
Illustrative Example: Sierra Leone
The Sierra Leone Multi-City Hazard Review and Risk Assessment provides a useful case study to understand the difference between qualitative and quantitative approaches to landslide risk as the assessment implemented both qualitative and quantitative types of hazard and risk assessment.
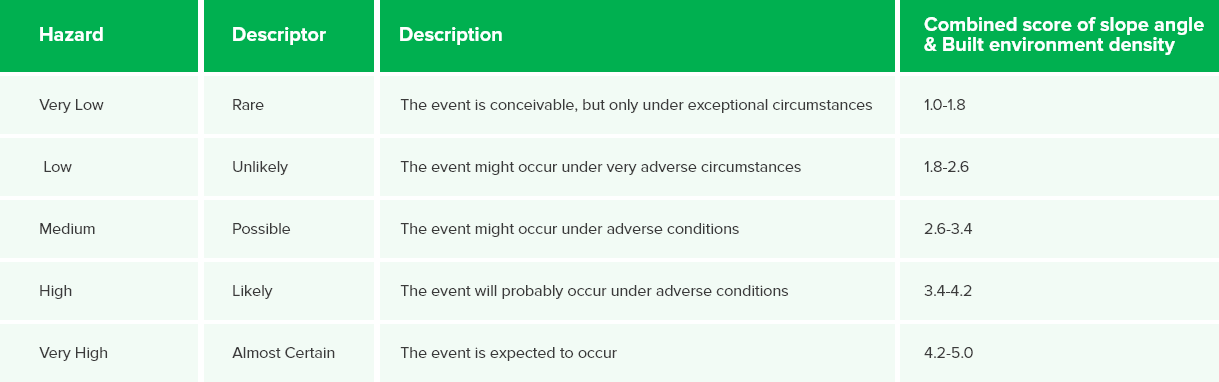
The qualitative hazard and risk assessment is based on simplistic relationships between hazard, exposure, vulnerability and risk as determined by expert scientific judgement and local knowledge to identify areas of varying risk levels (low, medium, and high) for various hazards (flooding, landslides, coastal erosion and sea-level rise). The qualitative landslide hazard assessment multiplied the score of slope angle (with higher slope angles scoring higher) and density of the built environment (with higher densities scoring higher) with a weighted ratio of 75:25 for slope angle: environment density to map the qualitative hazards from very low to very high at a 30m resolution in the three cities included in the assessment. This qualitative hazard result is layered with a qualitative building and roads exposure and vulnerability assessment, where buildings and roads data are combined into a built environment density representing the proportion of each 30mx30m area that is covered by buildings or roads. The qualitative risk maps that result from the hazard and exposure/vulnerability are not differentiated across exposure type and provide a first-level overview of natural hazard risk, from very low to very high.
Scoring for qualitative landslide hazard assessment
In the same project, a quantitative hazard and risk assessment was implemented to model landslide hazard/susceptibility, exposure, vulnerability and risk. Susceptibility was modeled using elevation, slope angle, slope aspect, and distance to rivers. The hazard assessment included both landslide frequency-magnitude analysis and runout modeling. Exposure and vulnerability were quantitatively assessed for both human and physical damage. Risk estimates are provided in quantitative terms as the product of the probability of landslide hazard and the impacts (exposure and vulnerability).