Kaligandaki [Environment/Subnational Landscape]
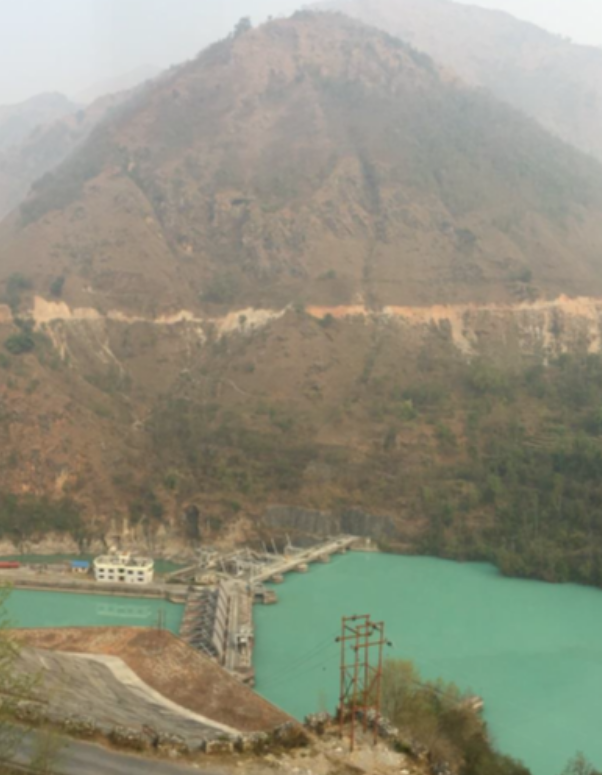
Introduction: Kaligandaki Landslide Assessment
As part of an ASA on Integrated Catchment Management for Sustainable Hydropower, the World Bank conducted a study to value watershed management practices for sediment reduction in the Kaligandaki watershed, Nepal. The study focused on developing methodologies to value a range of ecosystem services that come from watershed management in the form of investments in green infrastructure, and to prioritize their application in the Kaligandaki watershed. Given that sediment retention is one of the most immediate and visible impacts of watershed management activities, the study focused on the benefits that result from avoided erosion and sedimentation and looked secondarily at some of the co-benefits that arise from activities employed to control sediment. The study incorporated a landslide risk assessment because landslides are a significant and possibly even the dominant source of sediment in the Kaligandaki watershed, while at the same time imposing numerous social, environmental and economic costs in the area, including loss of life and property and damage to infrastructure, such as roads. The landslide risk assessment was followed by a prioritization of watershed management practices to reduce landslide risk, and an economic analysis estimating the benefits of these practices.
Link to e-book: http://www.appsolutelydigital.com/Kaligandaki/
Data
Nearly all parameters in this model (which includes sediment delivery from landslides, runout and landslide location) can be derived from global datasets (DEMs, soil depth) or are interpolated from location-specific observations (extreme rainfall probabilities based on observed rain gauge data). Some geotechnical parameters, such as soil cohesion and internal angle of friction, are taken from global data as they are not commonly available at watershed scales, Nepal-specific observations were rare or absent.
Specific landslide data used in the analysis are summarized in Table X.
Data used for the Kaligandaki LRA

Methodology
The model is a landscape-scale landslide risk assessment using the factor-of- safety approach together with a landslide run-out methodology to account for the spatial connectivity of hillslope processes. Approaches for landslide hazard mapping on catchment scales are commonly based on evaluating the factor of safety equations only on the scale of individual cells in a gridded model domain. While slope stability on the level of individual cells is potentially a causal factor in the creation of landslides, slope stability analysis on the scale of single cells does not consider for the spatial connectivity of hillslope processes. This is a major limitation for both estimating the spatial extent of potential landslides and their downslope runout zone and hence identifying structures at risk on the slide. Understanding connectivity of landslide prone cells is also crucial to estimate landslide magnitude in terms of sediment mobilization which is critical for analyzing landslide hazards and landslide contributions to catchment sediment budgets.
To address this limitation, the Kaligandaki report assesses Landslide Objects (LSOs) as the unit of analysis for catchment-scale landslide hazard screenings. LSOs make it possible to understand landslide magnitude (slide extent and volume and mass of mobilized sediment), which is critical to catchment sediment and hazard management as it provides information on how well a landslide zone is connected to the river network and how much sediment might be mobilized into that network. These LSOs are identified from an analysis of downslope connectivity amongst failure prone cells and are then integrated into a probabilistic hazard assessment driven by spatially generalized extreme-value distributions for precipitation in Nepal as detailed in the steps below.
- Calculate the failure probability of cell i using the Factor of Safety method.
- Identify connected landside objects (LSOs). To identify cells which might be possibly unstable and form failure-prone areas, the study analyzes the lowest and highest risk conditions of a watershed. According to the factor of safety calculations, the lowest risk of failure for a cell will occur if saturation is null, i.e., min(𝐹𝑆𝑖)=𝐹𝑆(𝑚𝑖=0) while the highest risk of failure occurs if soil is fully saturated max(𝐹𝑆𝑖)=𝐹𝑆(𝑚𝑖=1). Based on these considerations there are three possible conditions of a slope:
- 𝐹𝑆(𝑚𝑖=0)<1, unconditionally unstable area identifies slope pixels which are not stable even for completely dry conditions. This identifies areas without stable soil mantle
- 𝐹𝑆(𝑚𝑖=1)>1, unconditionally stable areas identify slope pixels that will not fail even for completely wet conditions.
- 𝐹𝑆(𝑚𝑖∗)≤ 1 conditionally unstable areas identify slope areas which can fail as a function of changing soil moisture conditions.
The analysis filters all cells for which 𝐹𝑆(𝑚=1)>1 and with 𝐹𝑆(𝑚=0)<1, with the remaining cells identifying parts of a hillslope that are possibly prone to failure. The connected conditionally unstable areas are identified following a downslope gradient, and the set of connected conditionally unstable cells is treated as a single LSO, with 𝐿𝑆𝑂𝑘 being the cell belonging to the LSO with identifier 𝑘, which includes 𝑛𝑘 cells.
- Determine the joint probability with which cells of 𝐿𝑆𝑂𝑘 will fail. This probability is taken as the mean failure probability of cells belonging to 𝐿𝑆𝑂𝑘.
- Estimate LSO volume. LSO volume is estimated using the power-law relationship between the surface area of a landslide and the volume of the mobilized sediment as detailed in Larsen et al 2010.
- Estimate landslide run-out length. Runout length is estimated as a function of the mobilized sediment volume, which incorporates both the volume of the landslide and the downslope topography (a larger landslide on a steep slope will travel farther than a smaller landslide on a gentler slope). Sources for this method are Rickenmann 1999 and Rickenmann 2005.
- Estimate landslide hazard to buildings and roads. Locations of roads and houses are derived from the Open Street Map dataset. However, road-induced slides are not modeled because road and other infrastructure-related factors that may trigger landslides occur at a higher resolution than that used in the model.
- Model management interventions
Nature-Based Mitigation Measures
In Nepal, landslides frequently occur because of rain-induced changes in slope water saturation as heavy storms hit slopes that are already saturated by monsoonal rainfalls (Gabet et al. 2004). Landslides can damage assets such as roads, fields, or structures that are built on a failing slope, as well as when mobilized sediment travels downslope (referred to as “runout”). The maintenance and improvement of vegetation cover can help to stabilize slopes, slough off rain before it infiltrates, channel water away from vulnerable slopes, and increase soil strength (Collison, Anderson, and Lloyd 1995; Vanacker et al. 2003). Reducing the risk of landslides through watershed management – where appropriate – can have downstream benefits, by reducing the amount of sediment reaching rivers, as well as local benefits, by avoiding loss of life and damages to infrastructure.
Three elements are assessed in order to input results from the landslide risk assessment methodology to the economic analysis:
- Identification of management measures available for landslides in the Himalayas, e.g., regarding required skills, materials and costs;
- Evaluation of the costs to treat an LSO; and
- Evaluation of the resulting change in LSO failure probability.
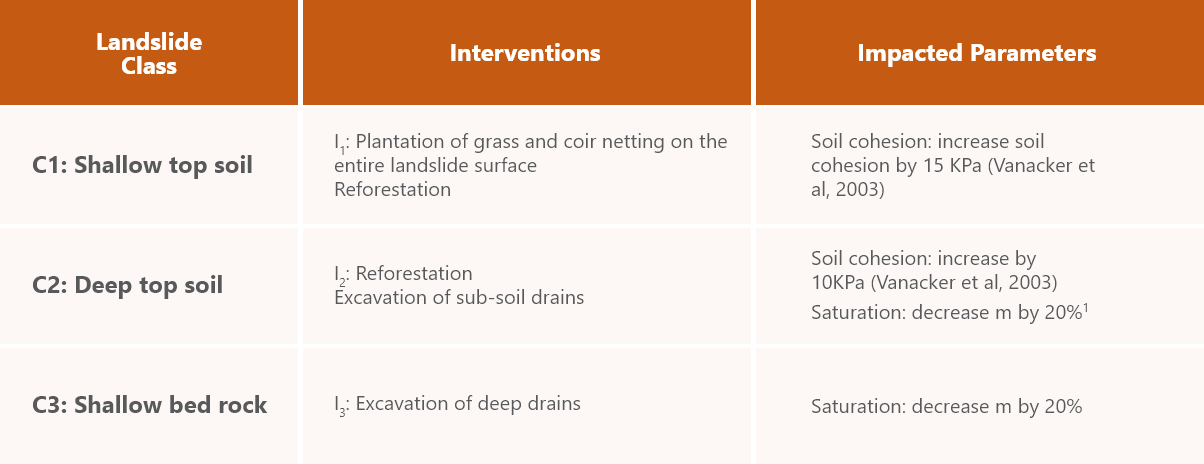
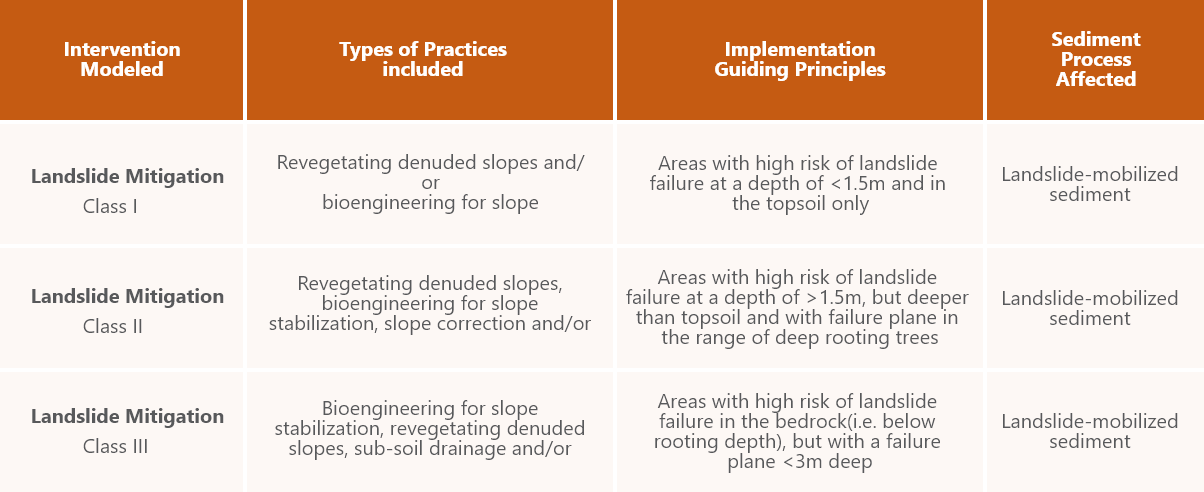
For point 1 and 2, this study uses data reported by Dahal and Dahal 2017, and focuses on two types of nature-based mitigation: tree and bamboo plantations, and installation of subsoil drains. These were selected because changes in root cohesion and soil moisture can be directly represented in the model by changing the wetness parameter 𝑚 and the root cohesion parameter 𝛿𝑐. The study notes that modeling hard engineering solutions is challenges on catchment scales (and is not included in the analysis) and that the low-cost engineering methods selected are not suitable to address very large landslides with deep-seated failure planes. For this reason, the study classifies landslides identified by the model into four groups with increasing magnitude in order to develop a “prototype portfolio” of measures that can be applied for the mitigation of the first three types. The classification is:
- Shallow landslide (<1.5m) in the topsoil (i.e., landslide depth < soil depth). The minimum depth of an LSO is given by the cellsize and is around 1.4 m. Hence the 1.5 m threshold. Failure plane in the range of deeper rooting plants and trees.
- Landslide depth > 1.5 m but still in the topsoil. Failure plane in the range of deep rooting trees.
- Landslide depth > depth of the topsoil, but less than 3 m. Failure plane in the bedrock (i.e., can’t be reached by roots quickly) but still possibly in the range for soft / grey-green engineering
- Landslide depth > 3 m. Deep seated landslides which would require massive engineering for mitigation. Not considered for mitigation measures but useful information for hazard mapping and disaster awareness.
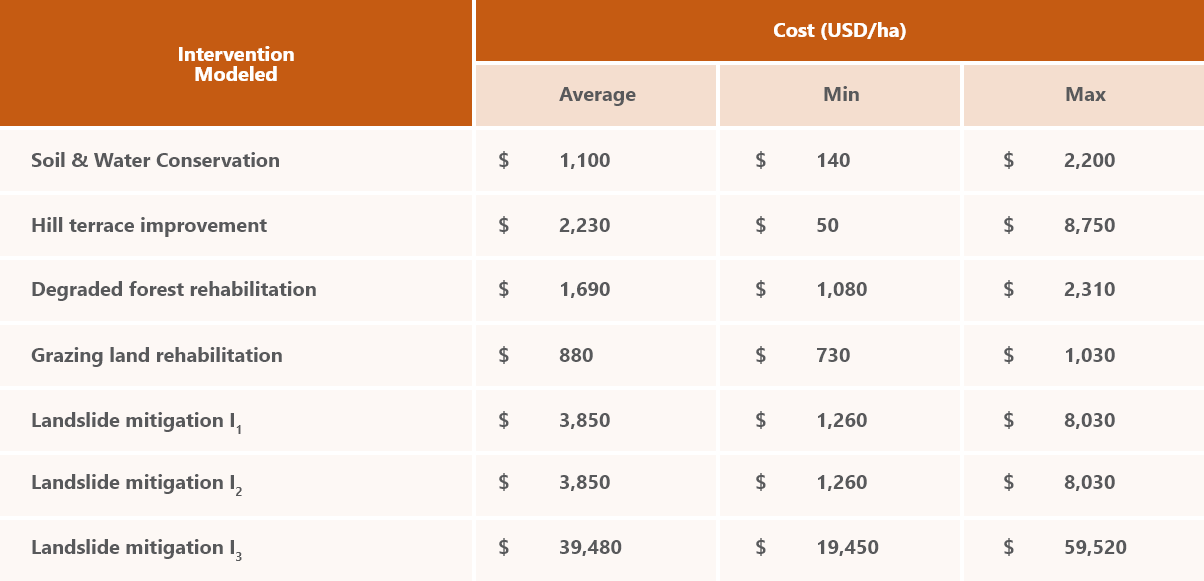
To model the impact of different mitigation strategies, we design a prototype mitigation strategy for landslide classes 1 – 3. It is challenging to quantify the impact of specific strategies on the parameters of the model and the herein presented values are a first, expert-based attempt on the parameter estimation. We change the model parameters for all considered landslides according to Table 5 below (e.g, for all landslides of type 1, we apply the appropriate mitigation measure), which then results in a change in probability of slope failure. This probability is then used to evaluate the change in value of roads and structures at risk and to quantify the changed sediment mobilization. Cost estimates are provided for each landslide mitigation method modeled.
Detail of Landslide interventions and impacted model parameters
Detail on interventions modeled in the study
Cost Summary for interventions modeled
This change in probability of slope failure implies a reduction in the sediment load to rivers as well as the risk to lives, structures and property associated with those landslides. Therefore, the resulting change in LSO failure probability is evaluated by comparing the pre- and post-intervention model results to obtain the change in mobilized sediment. Avoided sediment produced as a result of landslide mitigation is reduced by 5% to account for deposition in the river channels and the resulting change in sediment is valued as a benefit for KGA (see Section 3.3.5). The 5 % reduction is to account for the effect that not all sediment that has been mobilized from a landslide and reached the river channels will be transported through the river network (here we assume that a 5 % fraction is deposited in the river channels based on our analysis of sediment transport in Section 3.2.5).
Finally, the modeled change in probability of LSO failure as a result of mitigation measures is applied to the values of lives and assets at risk, as described in the following section.
Landslide Risk
In this study, values associated with three of the most important benefits are estimated: lives lost (value of a statistical life), structures destroyed (earnings that could be realized from owning it this year – its rental value – plus its expected present value next year), and roads damaged (expected cost of repairs).
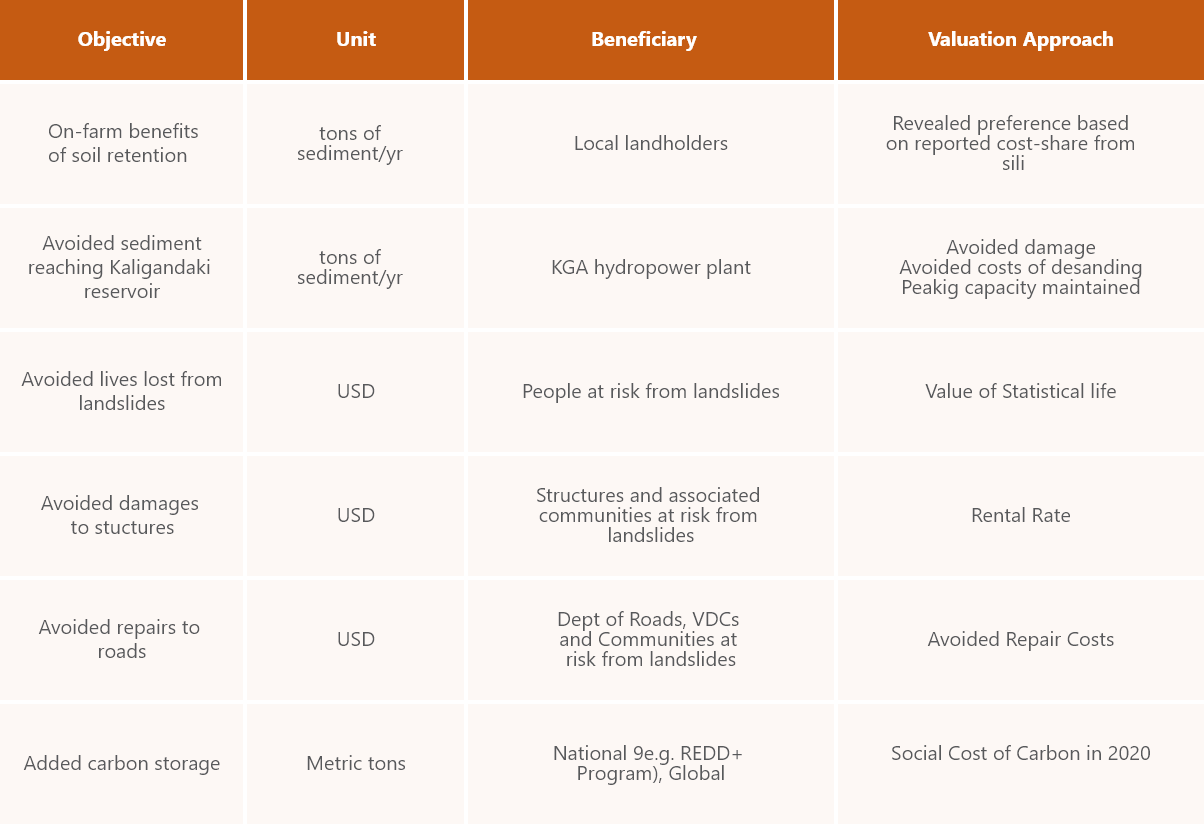
The first step in prioritizing where different activities should be implemented is to understand where in the watershed each activity can be most effective to achieve a set of objectives, and then use a multi-dimensional optimization approach to identify a set of optimal portfolios of interventions that maximize objectives at minimal cost. The objectives used in the optimization are listed in Table 3.5.
Objectives used to prioritize watershed management activities and locations
Results
The of the landslide risk assessment are: (1) identification of the spatial extent of possible landslides (LSOs) and their runout, (2) the probability of failure for specific LSOs, (3) the amount of sediment mobilized from a potential slope failure, and (4) an estimate for hazards to specific assets given implementation of different landslide mitigation activities.
The figure below shows the results of the landslide model for an area in the middle Kaligandaki sub-watershed. Reddish areas show the parts of the hillslope that are prone to failure. The different shades of red indicate that different connected parts of a hillslope (LSOs) will fail with different probabilities. The brown cells indicate modeled runout paths that begin at the downslope end of each LSO. Runout paths are colored in different shades of brown, according to the failure probability of the LSO from which they originate. Note that many houses and roads are located either on LSOs or on runout paths from upslope LSOs.
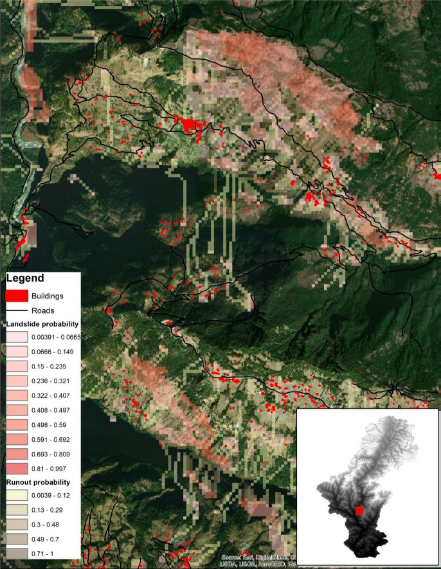
Figure 5: Results of the stochastic connectivity of landslides and runout tool for an area on the middle Kaligandaki River. Transparent landslide and runout data overlaid over satellite imagery, showing the origins of the major landslides from an escarpment in the top right area.
The assessment presents risk to different structures and roads in the basin according to the following graphs. The x-axis shows groups of buildings (left panel) and roads (right panel), grouped by the failure probability of their associated landslide and runout hazards, and the y-axis reports the percentage of the total buildings in each failure class. These results form the basis for the economic analysis, which considers monetary losses because of destroyed structures and lost lives. Population centers that are located within the runout path of landslides are places where a high risk of sliding corresponds to a high density of values at risk.
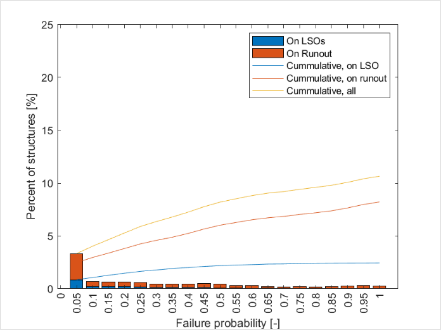
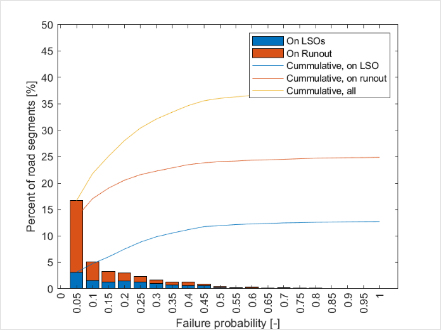
Figure X: Buildings (left) and roads (right) at risk, binned by the failure probability of the landslide/runout they are located on. Lines show cumulative values.
In the economic analysis, benefits are driven largely by local benefits and the value of avoided lives lost in landslides, with the next highest beneficiary being downstream hydropower (Figure 4.5).
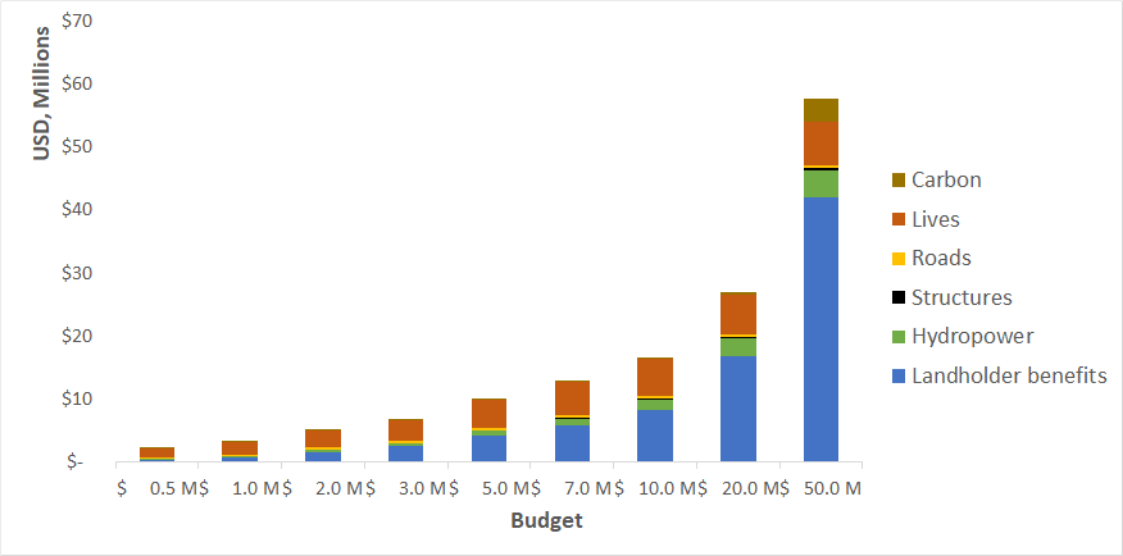
Figure 4.5: The multiple values of watershed management. The benefits are driven largely by local benefits and the value of avoided lives lost in landslides, with the next highest beneficiary being downstream hydropower (KGA). Note that X-axis location only represents distinct budget scenarios; it is not proportional to the cost of each portfolio.
Key Takeaways
The technical approach (factor of safety) employed in the landslide risk assessment allowed for a process-based evaluation of NBS solutions on landslide risk and on the resulting change in landslide risk on people and homes at risk. The factor of safety approach provides input variables that can be changed based on knowledge of how various NBS risk reduction methods may change the variables (e.g. soil cohesion).
The watershed-level geographic range of the technical approach allowed the study to evaluate management options and quantify benefits across multiple sectors for landslide risk reduction. Cross-domain benefit assessment such as this is possible at a landscape/watershed scale.
Overall, the technical approach allowed the study team to evaluate the multiple benefits of NBS and managing landslide risk.